On this page
This article is the full data version of that finding: 6,945 touches of the ±2σ daily VWAP band on XAU/USD, across 830 trading days. The short answer to the title is that 72% of touches revert to VWAP before the end of the day, only 23% do it within an hour, and the answer changes enormously depending on the session you trade. If you trade New York, the number you need is 30%, not 97.6%.
How we measured it
The setup is deliberately simple, so that anyone can reproduce it:
- Data: XAU/USD spot (Dukascopy), January 2023 → August 2026, 830 trading days.
- VWAP: anchored daily, with standard-deviation bands at ±1σ and ±2σ around it.
- Touch: price reaching the ±2σ band. We first measured only the day’s first touch (the statistic everyone quotes), then re-measured in a deep-check on all 6,945 ±2σ touches.
- Reversion: price coming back to the VWAP. We report it three ways, because the definition matters more than most people realise: back to the moving VWAP before the end of the day, back to the moving VWAP within a fixed 60 minutes, and back to the VWAP level frozen at the moment of the touch.
- Regime: classified from the prior day’s daily ADX/DI readings — Range, Transition, Trend up, Trend down — so it is known before the touch happens.
One baseline before any reversion talk. Over the whole sample, price sat inside ±1σ 44.7% of the time and inside ±2σ 86.1% of the time. Being beyond the ±2σ band is uncommon, but it is an ordinary state of the Gold market — which alone should make you suspicious of any statistic that says fading it works almost every time.
The mechanics of the anchor and of volume-weighted bands are covered in our session-anchored VWAP guide; here we only care about what price does after the touch.
The first-touch artifact
Here is the statistic as it is normally presented. Take the day’s first touch of the ±2σ band. Ask whether price gets back to VWAP before the end of the day. On our data the answer is yes 97.6% of the time, with a median wait of 50 minutes when it does revert (75th percentile 145 minutes, 90th percentile 380 minutes).
That looks like an edge. It is mostly a measurement artifact, for one reason: about 98% of first touches land in the Asian morning, between 02:00 and 04:00 Paris time. That is right after the bands have stabilised on a freshly anchored VWAP, when the bands are still narrow, and when the entire trading day is still ahead. A band that is easy to reach, plus a whole day of runway to come back, produces a reversion rate close to 100% almost by construction. We counted 826 first touches over 830 days — nearly every single day produces one.
Two consequences follow.
First, the 97.6% does not describe a London or New York trade. If you sit down at the London open, the day’s first touch already happened hours ago. The touch you are looking at is a second, fifth or tenth touch, and the first-touch statistic says nothing about it.
Second, any “before end of day” statistic flatters early events. A touch at 03:00 has the whole day to revert; a touch late in the New York session has very little. This is why a fixed horizon matters, and why we report one below.
The first pass of this study produced exactly that near-certain number, and it is the sort of figure that ends up on a sales page. It took the deep-check on every touch to see what it was really measuring.
All 6,945 touches: the honest number
When every ±2σ touch is counted, not just the first of the day, the picture is this:
| Scope | Reverted to VWAP before EOD | Reverted within 60 min | Median wait when it reverts |
|---|---|---|---|
| First touch of the day | 97.6% | — | 50 min |
| All touches (n=6,945) | 72% | 23% | 115 min |
| Touches in Asia | 95% | 34% | 105 min |
| Touches in London | 78% | 14% | 165 min |
| Touches in New York | 30% | 12% | 75 min |
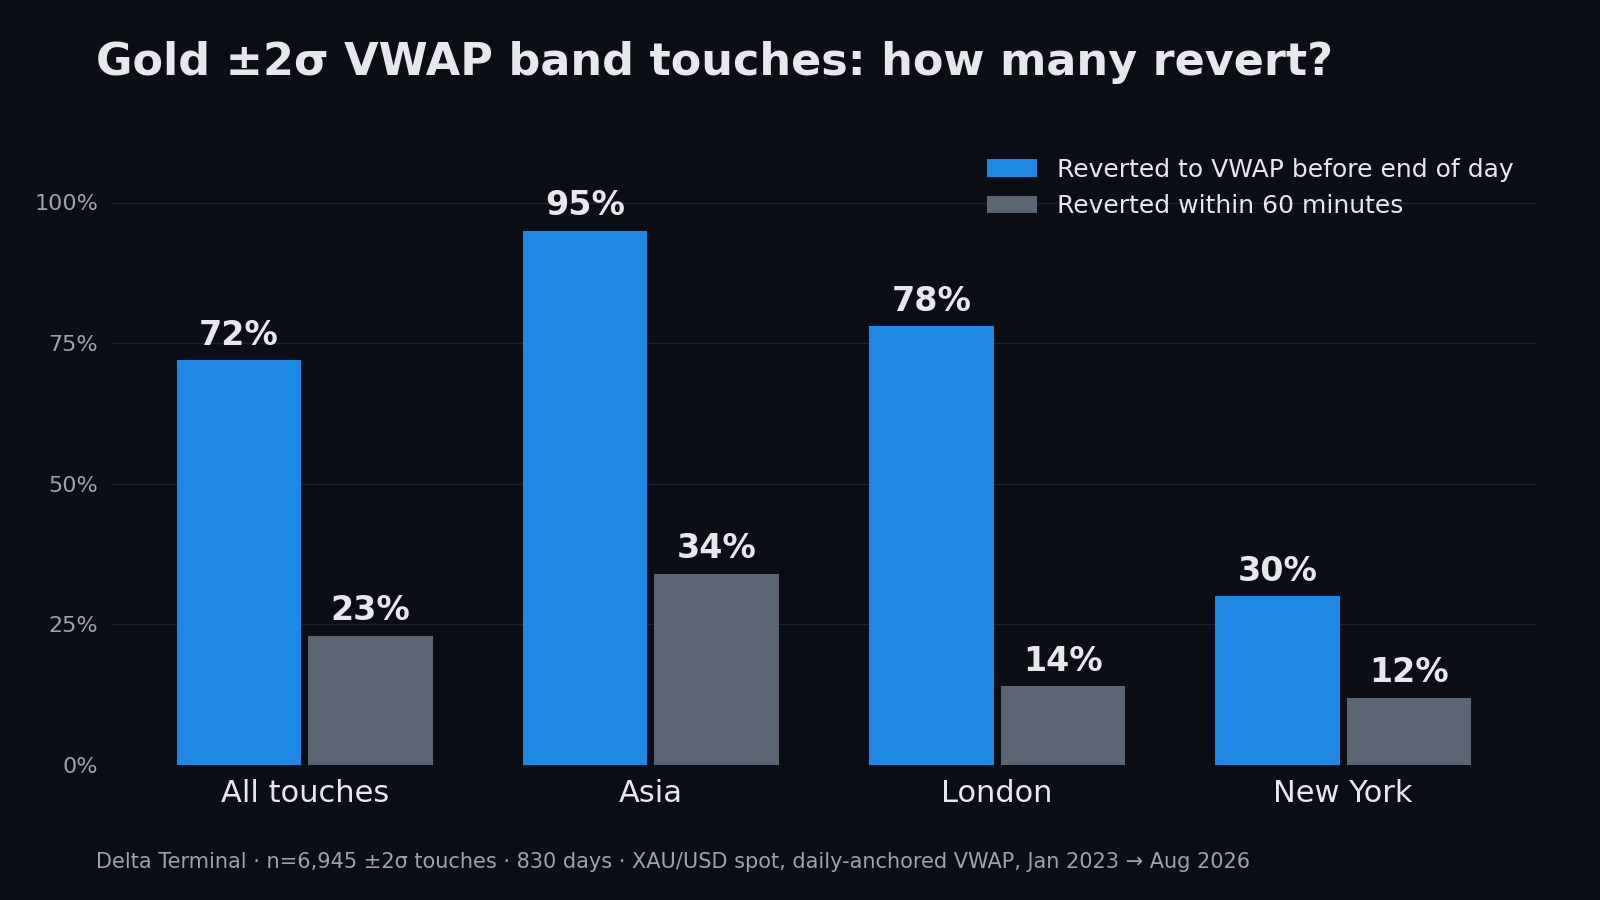
Three things are worth reading carefully.
The all-touches rate is 72%, and the wait is long. Across all touches the median wait is 115 minutes, and only 23% revert within 60 minutes. “It comes back” and “it comes back while I am still in the trade” are different statements.
The session gradient is steep. Before end of day: Asia 95%, London 78%, New York 30%. Part of that is runway — a New York touch has less day left — which is exactly why the fixed 60-minute horizon is the fair comparison. On that horizon the ranking holds: Asia 34%, London 14%, New York 12%. Even in the friendliest session, about one touch in three is back at VWAP within the hour. In London and New York it is closer to one in eight.
New York is a different market. Fewer than one in three New York touches see VWAP again before the close. A plausible reading is that this is where the day’s real participation is: in our volume-by-hour study, the 15:00 and 16:00 Paris hours carry 8.4% and 8.5% of the day’s volume, the heaviest of the day. A band touch made on that kind of participation is more likely to be a move than an excursion. Note also the 75-minute median wait for New York: it is short because only fast reversions can fit before the close, not because New York reverts quickly.
The anchor moves toward price
There is a second, quieter flattery inside every VWAP reversion statistic: the VWAP is not a fixed target. It is a running average, so while price sits away from it, every new bar drags it toward price.
We measured how much of the work the anchor does. At the moment of “reversion”, the VWAP itself has already closed a median 30% of the initial gap (75th percentile: 69%).
That matters for anyone actually trading the fade, because your entry and your idea of “the mean” are set at the moment of the touch. So we asked the stricter question: does price come back to the VWAP level frozen at the touch? Across all touches it does so in only 59% of episodes. In New York, 24%.
So the chain runs, from most to least flattering: 97.6% (first touch, by end of day) → 72% (all touches) → 59% (all touches, frozen level) → 23% (all touches, within 60 minutes). Same market, same bands, same data. Only the care in asking the question changes.
Regime: a smaller lever on reversion, a bigger one on the trade
The usual advice is “only fade the band in a range”. Here is what regime does to the raw reversion rate across all touches (before end of day):
| Regime | Reverted to VWAP before EOD (all touches) |
|---|---|
| Range | 73.5% |
| Transition | 76.1% |
| Trend up | 70.1% |
| Trend down | 70.3% |
The differences point the expected way, but they are small next to the session gradient. Regime moves the reversion rate by a few points; the session moves it from 95% to 30%.
But a reversion rate is not a trade. To see what regime does to an actual fade, we ran a simple close-based backtest on the day’s first touch: entry at the close of the first ±2σ bar, target the VWAP, stop at 3σ.
| Regime (first touch) | Reverted before EOD | n | Fade expectancy |
|---|---|---|---|
| Range | 98.5% | 272 | +0.22R |
| Transition | 100% | 111 | +0.44R |
| Trend up | 95.8% | 331 | +0.09R |
| Trend down | 98.2% | 111 | −0.27R |
The last row is the whole lesson in one line. In a Trend-down regime the first touch reverted 98.2% of the time, and fading it still lost, at −0.27R per attempt. Both statements are true at once, because the reversion statistic does not care what happens on the way: price can extend through a stop and only then rotate back to a VWAP that has been dragged toward it. The study counts that as a reversion. A trading account counts it as a loss.
Keep the scope in mind: because first touches cluster in the Asian morning, this table is essentially a test of an Asian-morning fade. It says nothing about fading a New York touch. These expectancies are close-based study results, not live trading results.
What this changes at the screen
Four practical conclusions:
- Retire the 97.6%. It is a first-touch, Asian-morning, end-of-day statistic. Unless that is precisely what you trade, it does not describe your trade.
- Read the session before the band. The identical ±2σ touch has reverted within the hour about one time in three in Asia and about one time in eight in London and New York.
- Classify the regime before fading, and skip downtrends. Regime barely changes whether price reverts; it changes what the path looks like before it does. The first-touch fade was positive in Range and Transition, marginal in Trend up, and negative in Trend down.
- Size your patience honestly. Across all touches the median wait is 115 minutes, and 165 minutes in London. If your plan assumes a quick snap back to the line, the data says that is the minority outcome.
This is the logic behind how our tools are meant to be combined. VWAP Session Bands draws the anchors and the bands; Hurst Regime Classifier answers the “is this a mean-reverting or a trending market” question before you act on a touch; Kalman Mean Reversion Signals waits for the stretch to actually turn rather than firing on the touch itself. None of them turns a band touch into a certainty. If you want to start with the session and regime context for free, the SLR Dashboard Lite is in our free tier.
See these numbers on your own chart
Delta Terminal's free tier includes a full TradingView indicator (SLR Dashboard Lite) and our Foundations ebook — no card, no countdown. The paid suite puts measured probabilities, session context and intermarket macro directly on your chart.
Start free on WhopThe same pattern — a popular rule that turns into a coin flip or worse once it is measured without cherry-picking — shows up in our other studies: liquidity sweeps reverse about half the time, and the full research papers are on the research page.
The honest limits
- One instrument, one window. XAU/USD spot, January 2023 to August 2026, a period dominated by a rising Gold market. Other instruments and other eras need their own measurement.
- Daily anchor only. These numbers describe the daily-anchored VWAP. Session-anchored VWAPs (Asia, London, New York) reset the clock and the bands, and we have not published the same breakdown for them.
- “Before end of day” flatters early touches. Prefer the 60-minute column when comparing sessions.
- The backtest is close-based. Entries and exits at bar closes, no spread, no slippage, first touch only. The expectancies show structure across regimes, not what an account would have earned.
- Spot, tick volume. The VWAP on spot Gold is weighted by tick volume, a proxy for true traded volume.
- Historical frequencies are not guarantees. Every figure here describes what happened in this sample. None of it promises what happens next.
Bottom line
Across 6,945 touches of the ±2σ daily VWAP band on Gold, 72% reverted to VWAP before the end of the day, with a median wait of 115 minutes, and only 23% did so within an hour. The famous near-certain figure, 97.6%, is a first-touch artifact of the Asian morning. By session, the end-of-day rate runs from 95% in Asia to 30% in New York; on a fair 60-minute horizon it is 34%, 14% and 12%. And in a Trend-down regime, a fade that “reverted” 98.2% of the time still lost 0.27R per attempt.
VWAP bands are a good map of where price is stretched relative to where volume traded. They are not a promise that the stretch ends on your schedule. “Reverts eventually” is not the same as “profitable fade” — session and regime decide.