On this page
We measured it. This article is a negative result, published on purpose: on the 39 gold option expirations in our sample, Gold closed near a $50 level less often than on a normal day, and the day’s range was slightly smaller than usual. Nothing in the data looks like a pin. If OPEX is in your Gold playbook, this is the number you were missing.
The theory, stated fairly
COMEX gold options (the options on the GC futures contract) expire on a fixed monthly schedule. On expiration day, every open option is either exercised or expires worthless, and the dealers who sold those options have been hedging them with futures all along. The “pin” argument says that as expiry approaches, the hedging flows around the strikes with the most open interest become self-reinforcing: a move away from a heavily populated strike gets sold or bought back, so price gravitates toward it into the close. On equity indices this idea has a long literature behind it. On Gold, where the liquid strikes are the round $50 increments, it becomes the “$50 theory”: OPEX days close at, or very near, a $50 level.
The mechanism is not absurd. Hedging flows are real and open interest does cluster at round strikes. The question is not whether the mechanism exists in principle; it is whether it is large enough to show up in the closing price of spot Gold. That is measurable, so we measured it.
How we measured it
The design follows the same rules as our other event studies: one dataset, one definition fixed in advance, and a control group of ordinary days rather than a handful of vivid examples.
- Data: XAU/USD spot (Dukascopy), the same data store that underlies our sweep study and our FOMC work.
- Events: every COMEX GC option expiration day in the window — n = 39.
- Control: all normal trading days in the same period, measured the same way.
- The pin test: at the day’s close, is price within $10 of the nearest $50 level? A ±$10 window is a generous definition of “pinned” — if the magnet exists, it should be easy to see at that tolerance. We compare the share of OPEX days closing inside the window to the share of normal days that do.
- The range test: the day’s range as a multiple of ATR, so that a wild month and a quiet month are comparable, OPEX days against normal days.
Two things we did not do, deliberately: pick the strike with the most open interest and track price around it (that would let us choose the target after the fact), and run a simulated trade. This measures where price closed and how far it travelled, nothing more.
Thirty-nine events is a small sample. It is also every expiration in the window — you cannot manufacture more — and it is the sample a trader actually has when deciding whether OPEX deserves a special rule. We come back to what that number can and cannot support below.
The result: fewer round-number closes on OPEX, not more
The entire finding, in one table.
| Measure | OPEX days (n=39) | Normal days |
|---|---|---|
| Close within $10 of the nearest $50 level | 25.6% | 35.1% |
| Day range as a multiple of ATR | 0.85× | 1.00× (by definition) |
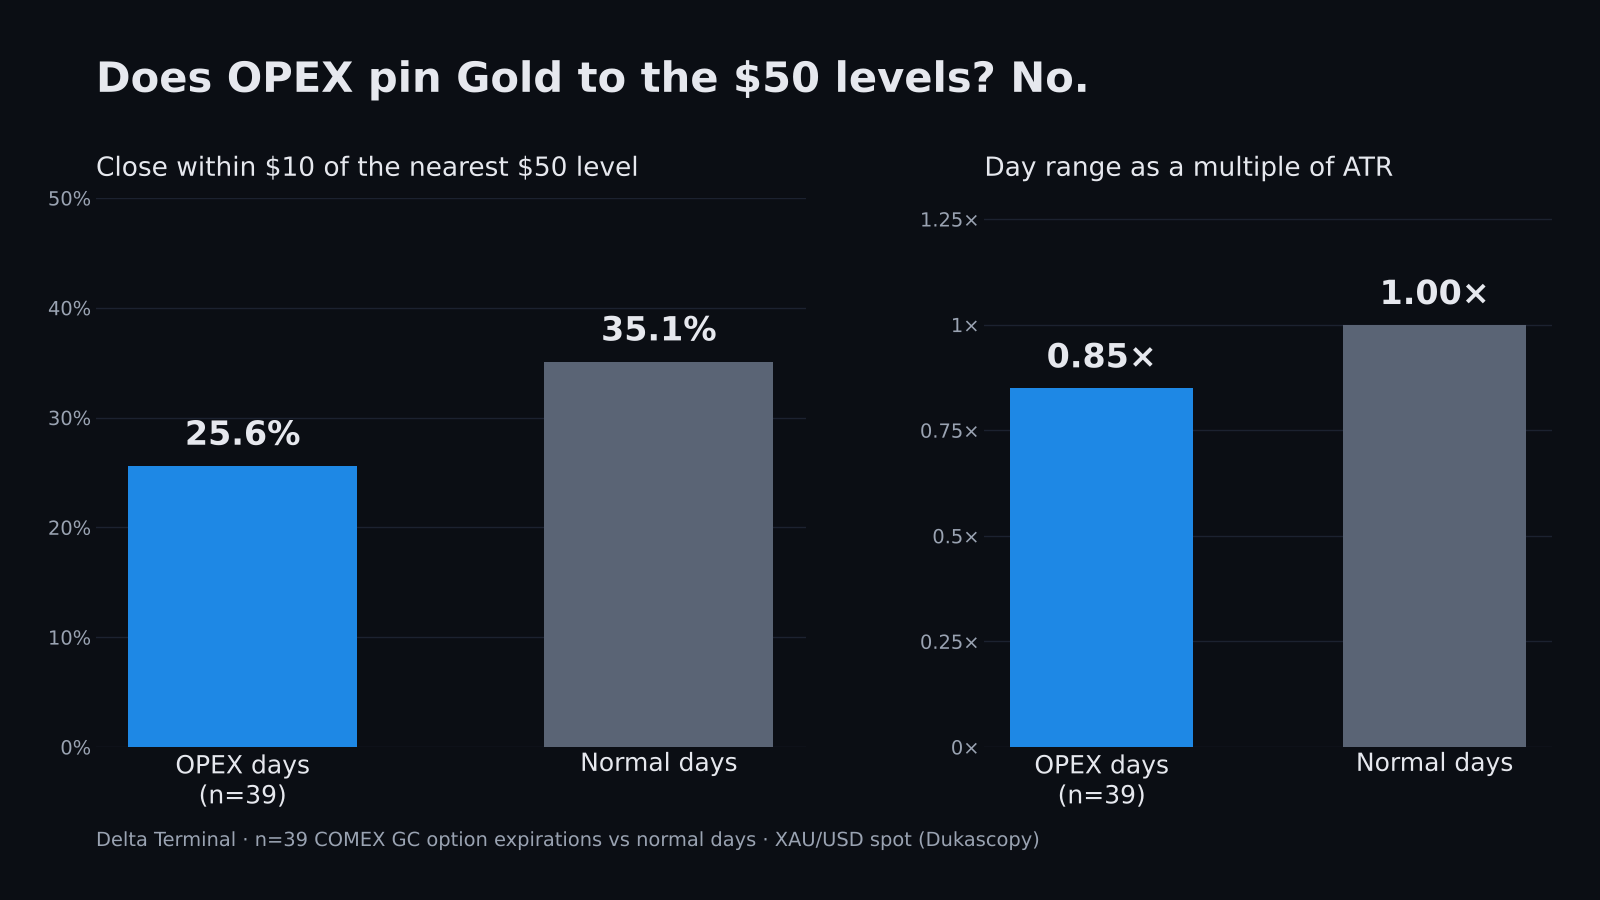
Read the first row again, because it is the opposite of the claim. On normal days, Gold closed within $10 of a $50 level 35.1% of the time. On option expiration days, 25.6%. If the $50 levels were magnets on OPEX, the OPEX number should sit well above the normal-day number. It sits below it.
We want to be careful about what “below” means. With 39 events, a gap of this size is not something we would present as “OPEX repels round numbers” — a few days either way would move the OPEX rate noticeably, and we will not dress this up with a significance test the sample cannot carry. What the data supports is the simpler, more useful statement: there is no sign of a pin. A pin large enough to matter to a day trader would be visible even at n=39. It is not there.
A small piece of arithmetic puts the normal-day number in context. A ±$10 window around every $50 level covers $20 of every $50 of the price line — two-fifths of it — so a close landing at random relative to the grid would fall inside about that often. The normal-day rate of 35.1% is in that neighbourhood, and the OPEX rate is lower. Neither number suggests that round numbers attract the close on Gold, on expiration day or any other.
The range: quieter, not pinned
The second row tells the rest. OPEX days ran at 0.85× ATR — a somewhat smaller range than an ordinary day, but nothing that would make you treat the session differently.
Compare that with an event that genuinely reshapes the Gold day. In our FOMC study, the full-day range on Fed days was 1.24× a normal day, the morning window before the announcement was compressed to 0.67×, the post-announcement window ran at 4.35× the same window on normal days, and about 79% of the day’s range landed after the 20:00 Paris statement. That is what a structural event looks like: a distinctive shape, large multiples, a clear before-and-after.
OPEX looks like none of that. A 0.85× day is a slightly sleepy day — not compressed the way an FOMC morning is, with nothing expanding afterwards. With the closing-price result, the picture is consistent: option expiration on Gold is a mildly quieter session whose close lands wherever the day’s flow takes it, not a session organised around a strike.
Why the pin story feels true anyway
If the data is this flat, why does the theory survive? Three reasons, none about Gold.
Round numbers are everywhere. The $50 levels are dense enough that price is always “near” one in some loose sense, so anyone watching Gold on an OPEX day will see price interact with a round number — as it does every day. The ±$10 window is the honest version of “near”, and the close lands inside it slightly less often on OPEX, not more.
Vivid examples beat base rates. An expiration day where Gold closes a dollar from a $50 strike gets screenshotted and shared. The one where it closes nowhere near a strike does not. With fewer than forty events, a trader’s memory of OPEX is built from a handful of memorable days, and the memorable days are the ones that fit the story — the same mechanism that keeps the “sweeps always reverse” claim alive at a measured 50%.
The mechanism is borrowed. Pinning is documented in single-stock and index options, where open interest at a strike can be large relative to the underlying’s daily liquidity. Gold is a deep, global, near round-the-clock market whose spot price is set by far more than the COMEX option book. The argument transfers in words, not in size.
What this changes at the screen
Four practical conclusions follow; the first is the one that matters.
- Drop OPEX as a Gold event. On this sample it does not pin, and it does not expand. A rule such as “fade moves away from the $50 level on OPEX” has no support in the closing data — the close was less likely to be near a $50 level than on an ordinary day.
- Expect a slightly smaller range, and nothing else. 0.85× ATR is worth knowing for sizing a target, as any quiet-day context is. It is not worth a special playbook.
- Save your event attention for events that measure like events. FOMC does: compression before, expansion after, a consistent shape across 25 occurrences. US 08:30 ET releases do — in our 08:30 ET study (181 releases), NFP was still continuing in the direction of its first move at the 15-minute mark 93.5% of the time (see the killzones article). OPEX does not belong on that list.
- Keep testing your own calendar rules. Every trader carries a few “on this day, price does X” beliefs, and most were never measured. Measuring one costs an afternoon; trading an imaginary edge for years costs considerably more.
This is the thinking behind the tools we build for context around the Gold day. The Range & ADR Tracker shows how much of a normal day’s range has already been used, which is the honest way to read a 0.85× day in real time. The GVZ Vol Monitor puts the implied-volatility backdrop on the chart, so a week that is quiet can be told apart from one that merely has OPEX on the calendar. And the Gold Macro Dashboard keeps the drivers that actually move Gold — the dollar, yields, silver — in view. None of them has an “OPEX mode”, because the data gives no reason to build one. If you want the session and regime context first, the SLR Dashboard Lite is in our free tier.
See these numbers on your own chart
Delta Terminal's free tier includes a full TradingView indicator (SLR Dashboard Lite) and our Foundations ebook — no card, no countdown. The paid suite puts measured probabilities, session context and intermarket macro directly on your chart.
Start free on WhopThe honest limits
A negative result deserves the same scrutiny as a positive one.
- n = 39 is small. It is the full set of expirations in the window, but the OPEX rate carries a wide margin. The result rules out a large pinning effect; it cannot rule out a small one, and we do not claim it does.
- One definition of “pinned”. We used the closing price and a ±$10 window around the $50 grid. A test built on a finer grid, on the futures settlement price rather than the spot close, or on the strike with the highest open interest is a different test and could in principle give a different answer. We chose the definition that matches how traders state the theory, and fixed it before looking.
- Spot, not futures. COMEX options settle into GC futures; we measured XAU/USD spot. The two track each other closely intraday but are not the same instrument — see our XAUUSD vs GC futures article. A pin that existed only in the futures settlement print would be invisible to this study, and also irrelevant to anyone charting spot.
- A fixed dollar window on a rising market. Gold’s price level changed a great deal over the sample, so $10 is a smaller fraction of price at the end than at the start. We kept the window fixed because that is how the theory is phrased; an ATR-scaled window would be a reasonable alternative.
- No path, no trade. Where the day closed and how far it travelled — no entries, stops or targets, no intraday path around the strike. Nothing here is a trading result.
- Historical frequencies are not guarantees. This describes 39 days in one period of one market, not the next expiration.
Why we publish a negative result
It would have been easy to leave this study in the folder: “nothing here” does not make a sales page and gives nobody a new setup. We are publishing it anyway, for the same reason we publish the sweep baseline and the audited fair value gap and order block papers: a probability you can verify is only worth something if the publisher is willing to show you the ones that came out flat.
A research process that only ever surfaces positive results is not research; it is marketing with error bars. Our tools are developed hand-in-hand with a full-time Gold day trader, and the most useful thing a study can do for that trader is remove a rule that was costing attention for nothing. OPEX was one of those rules. It is gone from the playbook; this is the receipt.
Bottom line
Across 39 COMEX gold option expirations, Gold closed within $10 of the nearest $50 level 25.6% of the time, against 35.1% on normal days, and the OPEX day’s range ran at 0.85× ATR. There is no pin in this data — if anything the close was slightly less likely to sit at a round number on expiration day, and the session was slightly quieter. The $50 theory, as traders state it, is not supported on Gold.
Less exciting than the story, and considerably more useful: one fewer thing to watch, and one more calendar belief replaced by a number.