Eighteen production-grade indicators for serious Gold & indices day traders: historical sweep statistics on the chart, intermarket macro context, sessions, liquidity and order flow. Every number verifiable, every method documented, nothing repainted.
Tested and approved by traders before launch · Free tier in 2 minutes · Paid plans: 30-day refund, cancel anytime · No signals, no “AI magic” — tools
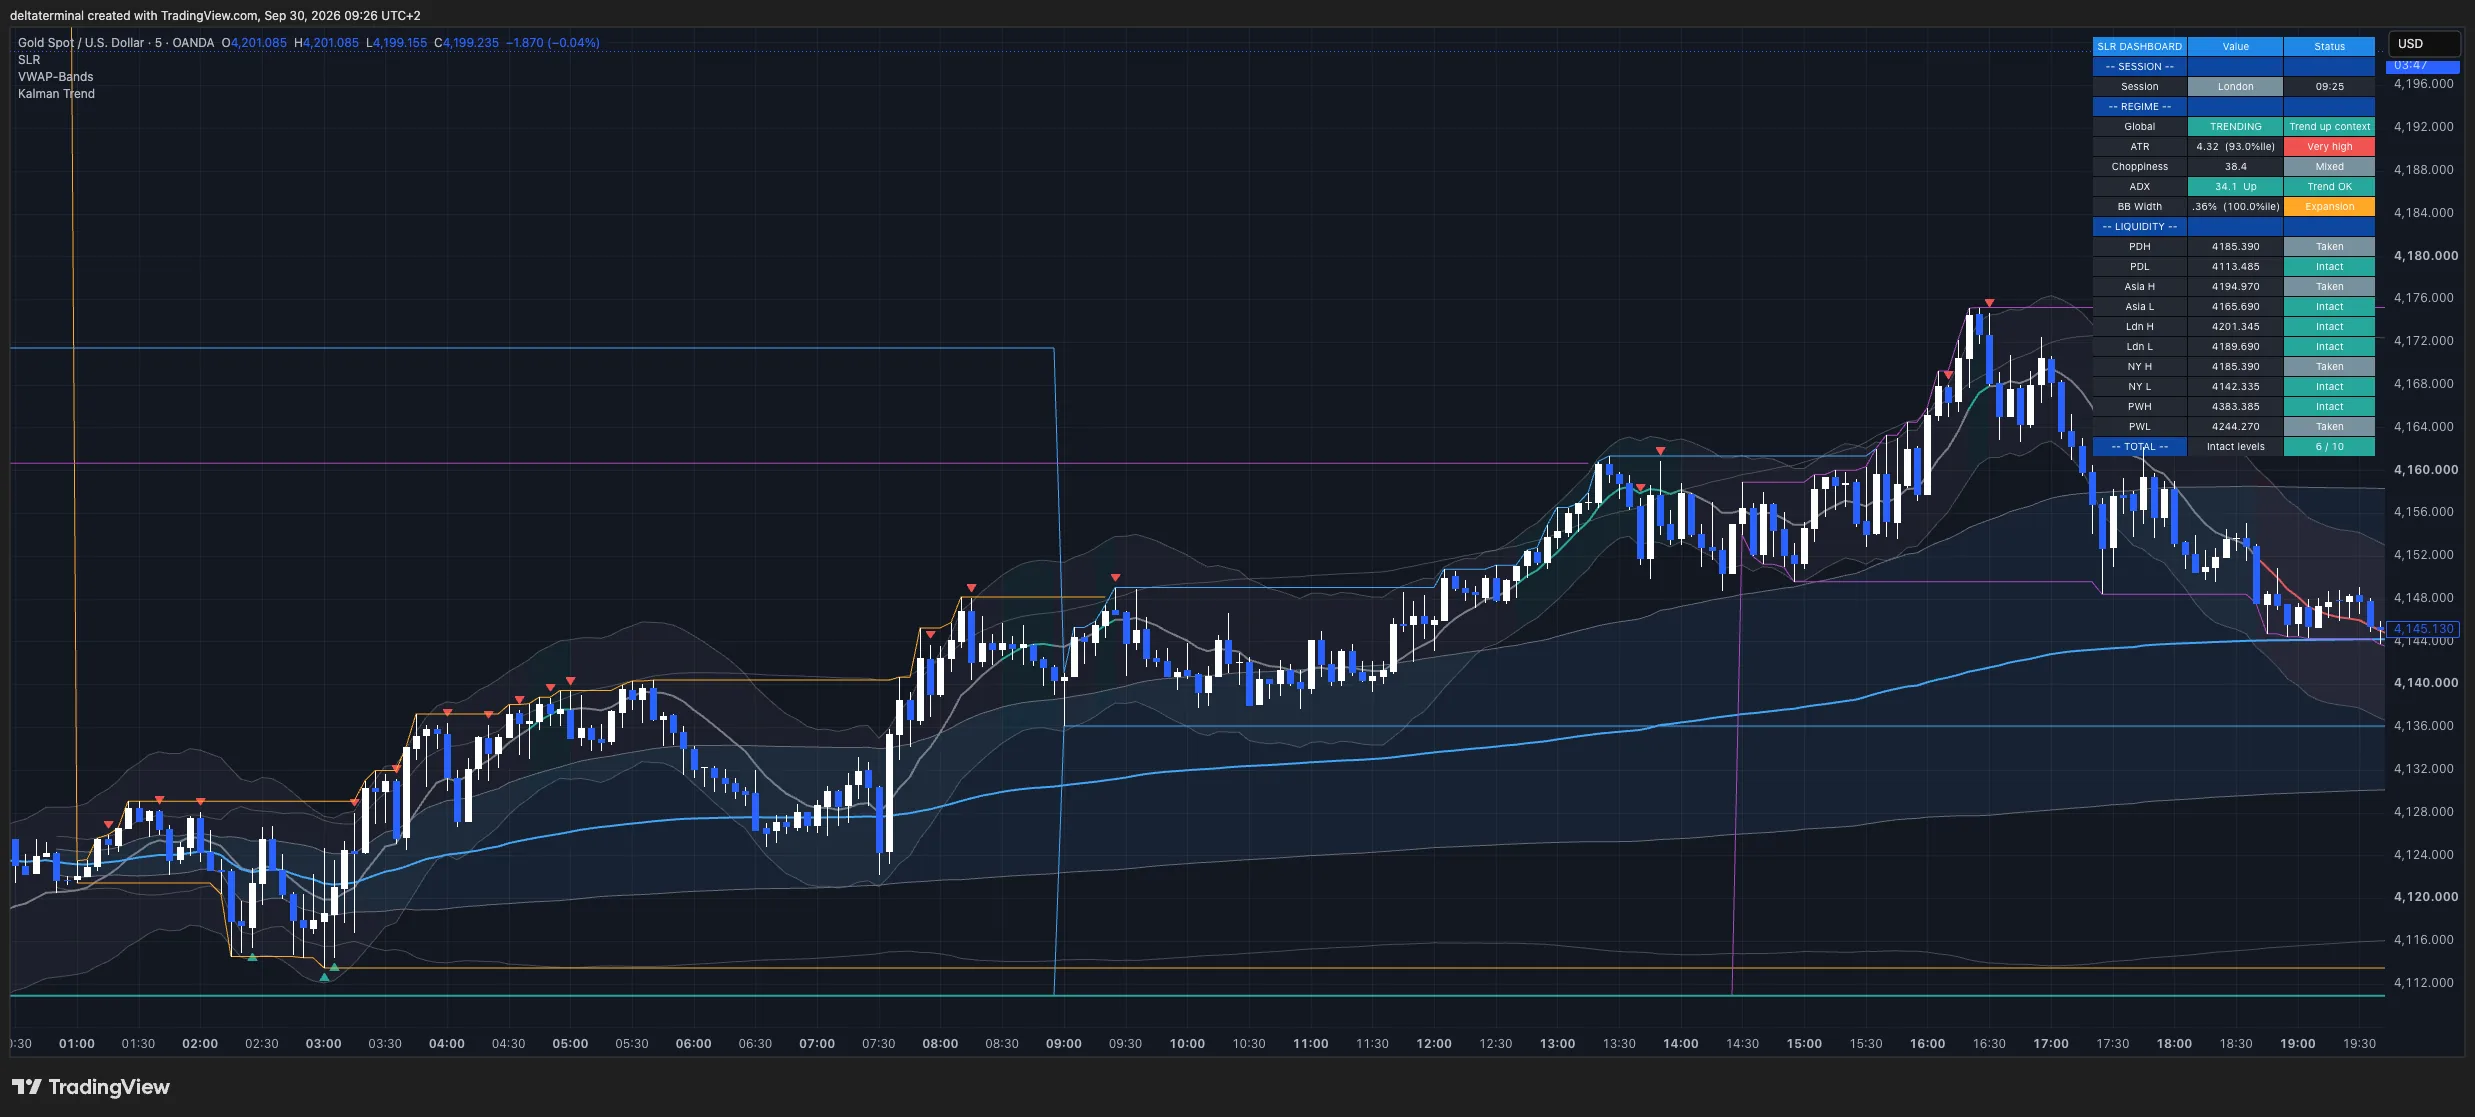
Most TradingView indicators repaint, lag, or sell you a black box. None of them put the session, macro and probability context that actually drives intraday price on your chart. This suite does.
You enter at the London open and get stopped by the Asia high 30 minutes later. Every day. The solution isn't willpower — it's seeing the sessions and killzones on the chart.
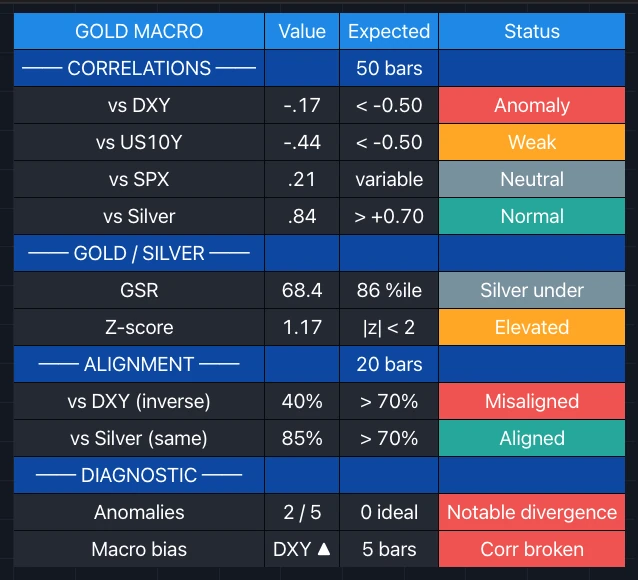
Gold and DXY decorrelate silently. Yields move against SPX. By the time you notice, you're already in the wrong trade. The intermarket dashboard catches it in one glance.
“Sweeps always reverse.” Do they? How often, how far, how fast — on your symbol? Sweep Outcome Stats measures every sweep on your chart history and prints the answer, with the sample size next to it.
Every indicator ships in Pine v6, fully audited (zero warnings), non-repainting, with full written documentation and alert conditions — and runs 100% on TradingView's native data. Core = 10 multi-market tools. Pro adds the 8 advanced Gold & statistics tools.
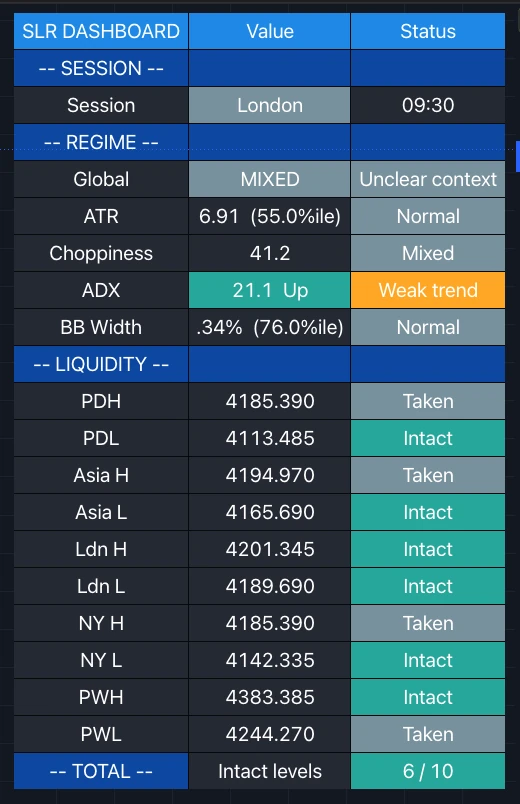
Sessions (Asia/London/NY), killzones, liquidity sweeps and market regime (ATR, ADX, Chop) in one dashboard. Replaces three indicators.
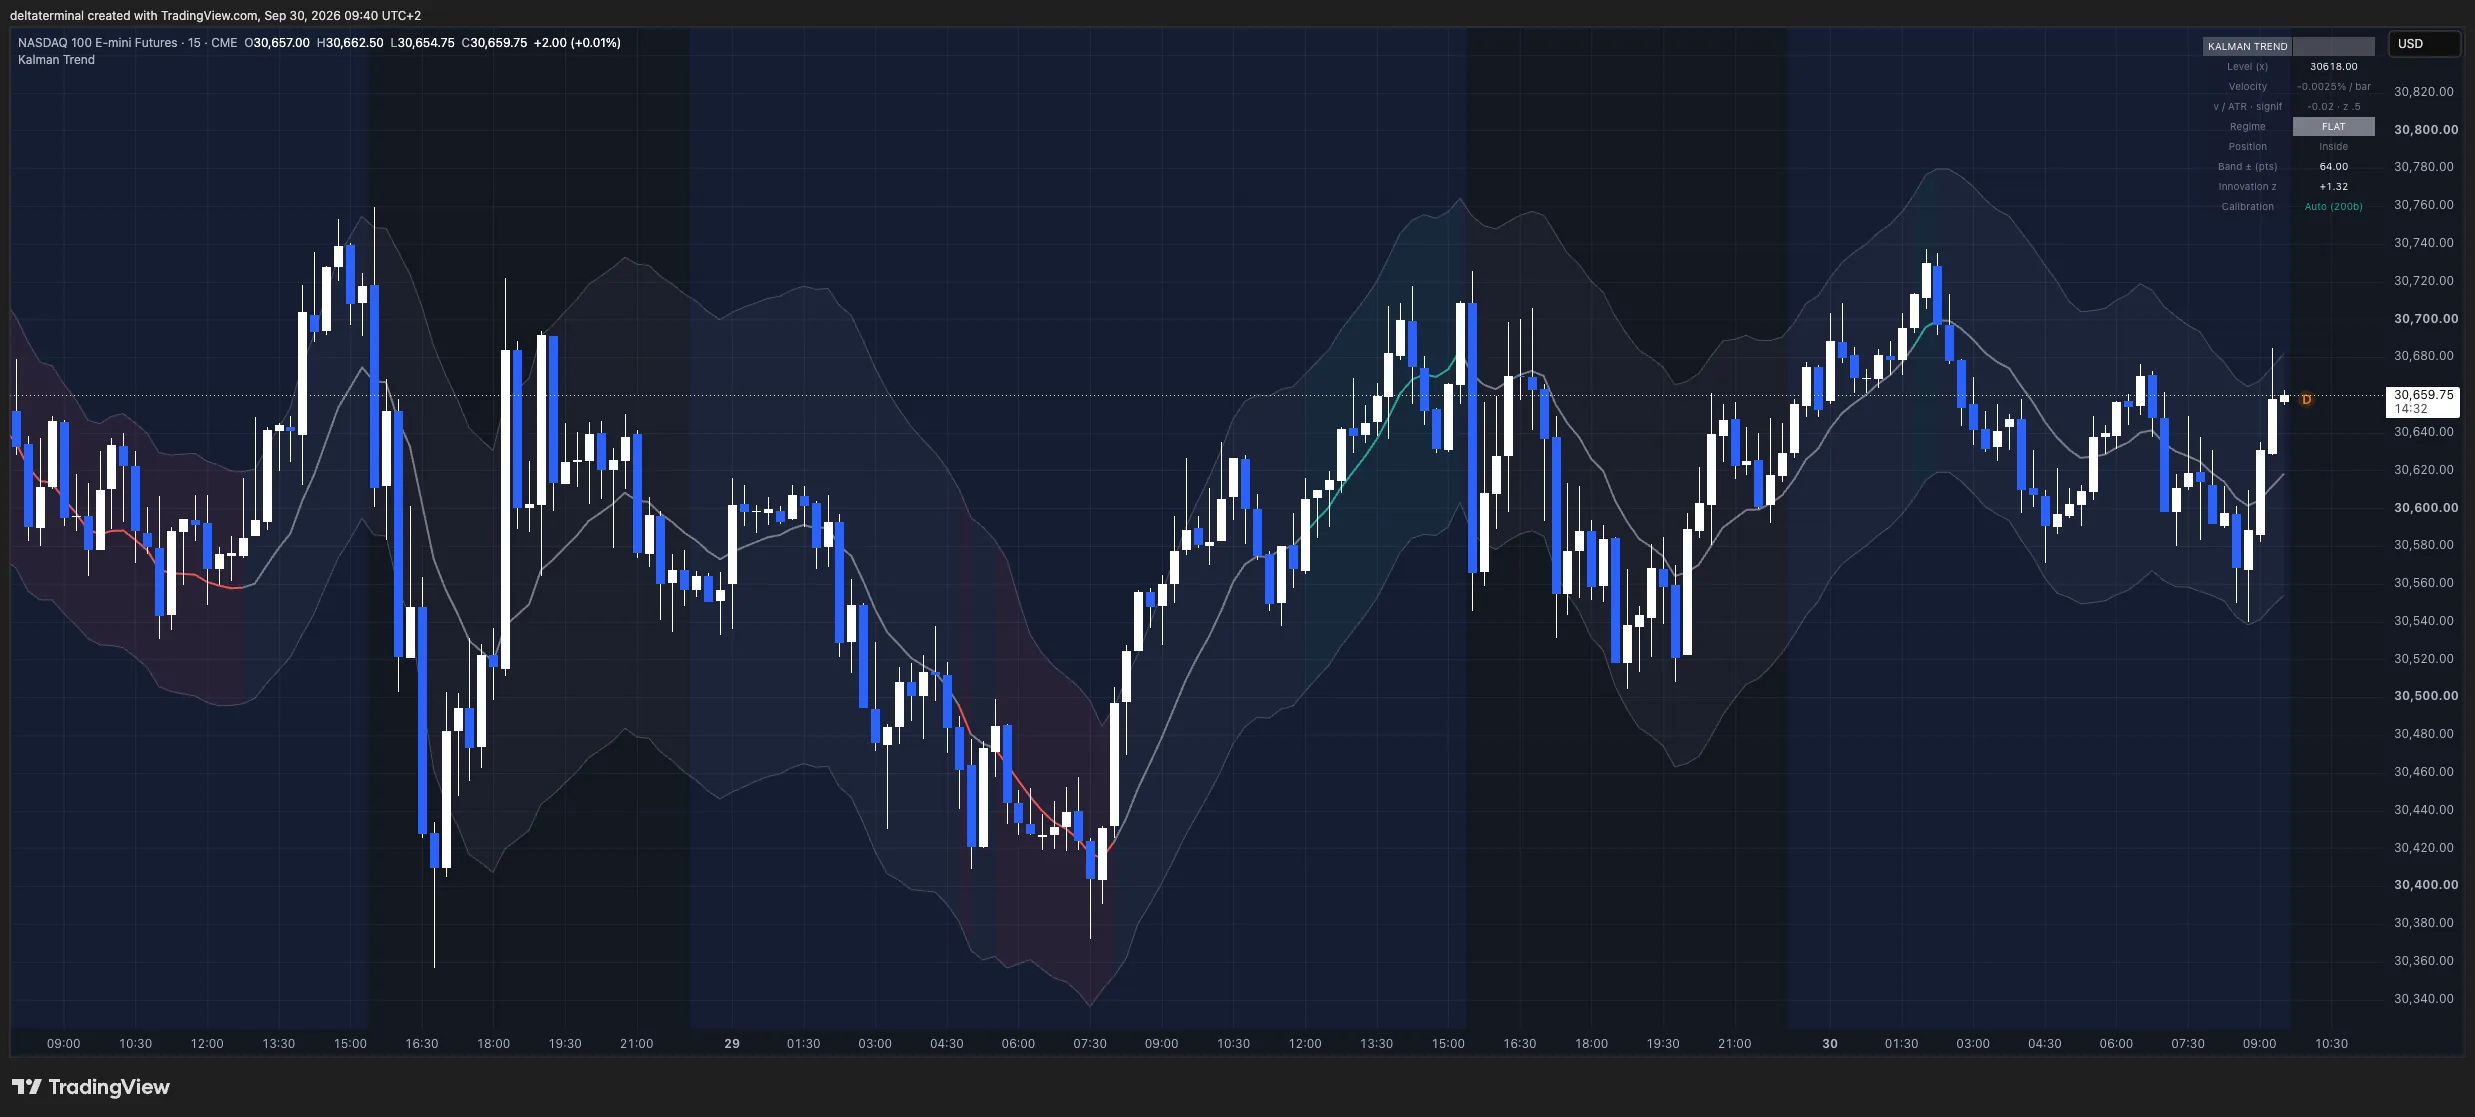
State-space adaptive trend with level + velocity, ±1σ/±2σ confidence bands, velocity oscillator. No fixed lag, no retuning.
Four session anchors, honest volume-weighted variance for the ±1σ/±2σ bands — not a cosmetic approximation.
FVG (ATR-filtered, auto-invalidating), BOS, CHoCH, Order Blocks, EQH/EQL. One pivot length, no repainting.
Session-anchored profile, honest per-bin distribution, POC / VAH / VAL, naked POC, volume skew.
Asia/London/NY highs & lows, PDH/PDL, PWH/PWL — plotted while intact, removed when swept, alert on every sweep.
How much of the normal daily range is already spent, the fuel remaining, and each session vs its own norm.
At which hours the High/Low of day statistically forms — and the probability today's extreme is already printed.
Participation vs the norm for this exact time slot — not a flat average. Validates breakouts, exposes fakes.
Clean multi-EMA ribbon reading trend agreement between fast and slow groups, with momentum coloring.
Rolling correlations with DXY, US10Y, SPX, Silver (on returns), GSR z-score, and an anomaly counter that flags a broken intermarket regime.
For every liquidity sweep in your chart history: how often price closed back through the level within 20 bars, how often it was still reversed at the horizon (Wilson 95% margin), how far it extended (ATR), how fast. Per level family, sample size shown.
Anchored profile (click / daily / weekly) with POC/VAH/VAL and a trapped-traders detector: aggression at the extremes followed by a reclaim.
Multi-scale R/S analysis (Anis-Lloyd corrected): trending, mean-reverting or random walk — on 5 timeframes, with a reliability score.
True intrabar delta from sub-bars, session-anchored, divergences and absorption. Tick-proxy vs real volume labeled on the chart.
Weekly CFTC positioning via TradingView's official COT library, indexed over 3 years, extremes flagged.
Gold's implied volatility vs realized, the risk-premium spread, and percentile context for both.
Fade stretched prices only in flat regimes: band touch + regime filter + velocity turn, with target and stop drawn. Close-only, no-repaint mode.
Every screenshot below is a plain TradingView snapshot of the indicator on XAU/USD (OANDA feed) or NQ futures — no mock-ups, no retouching. Click any image for the full-resolution version.
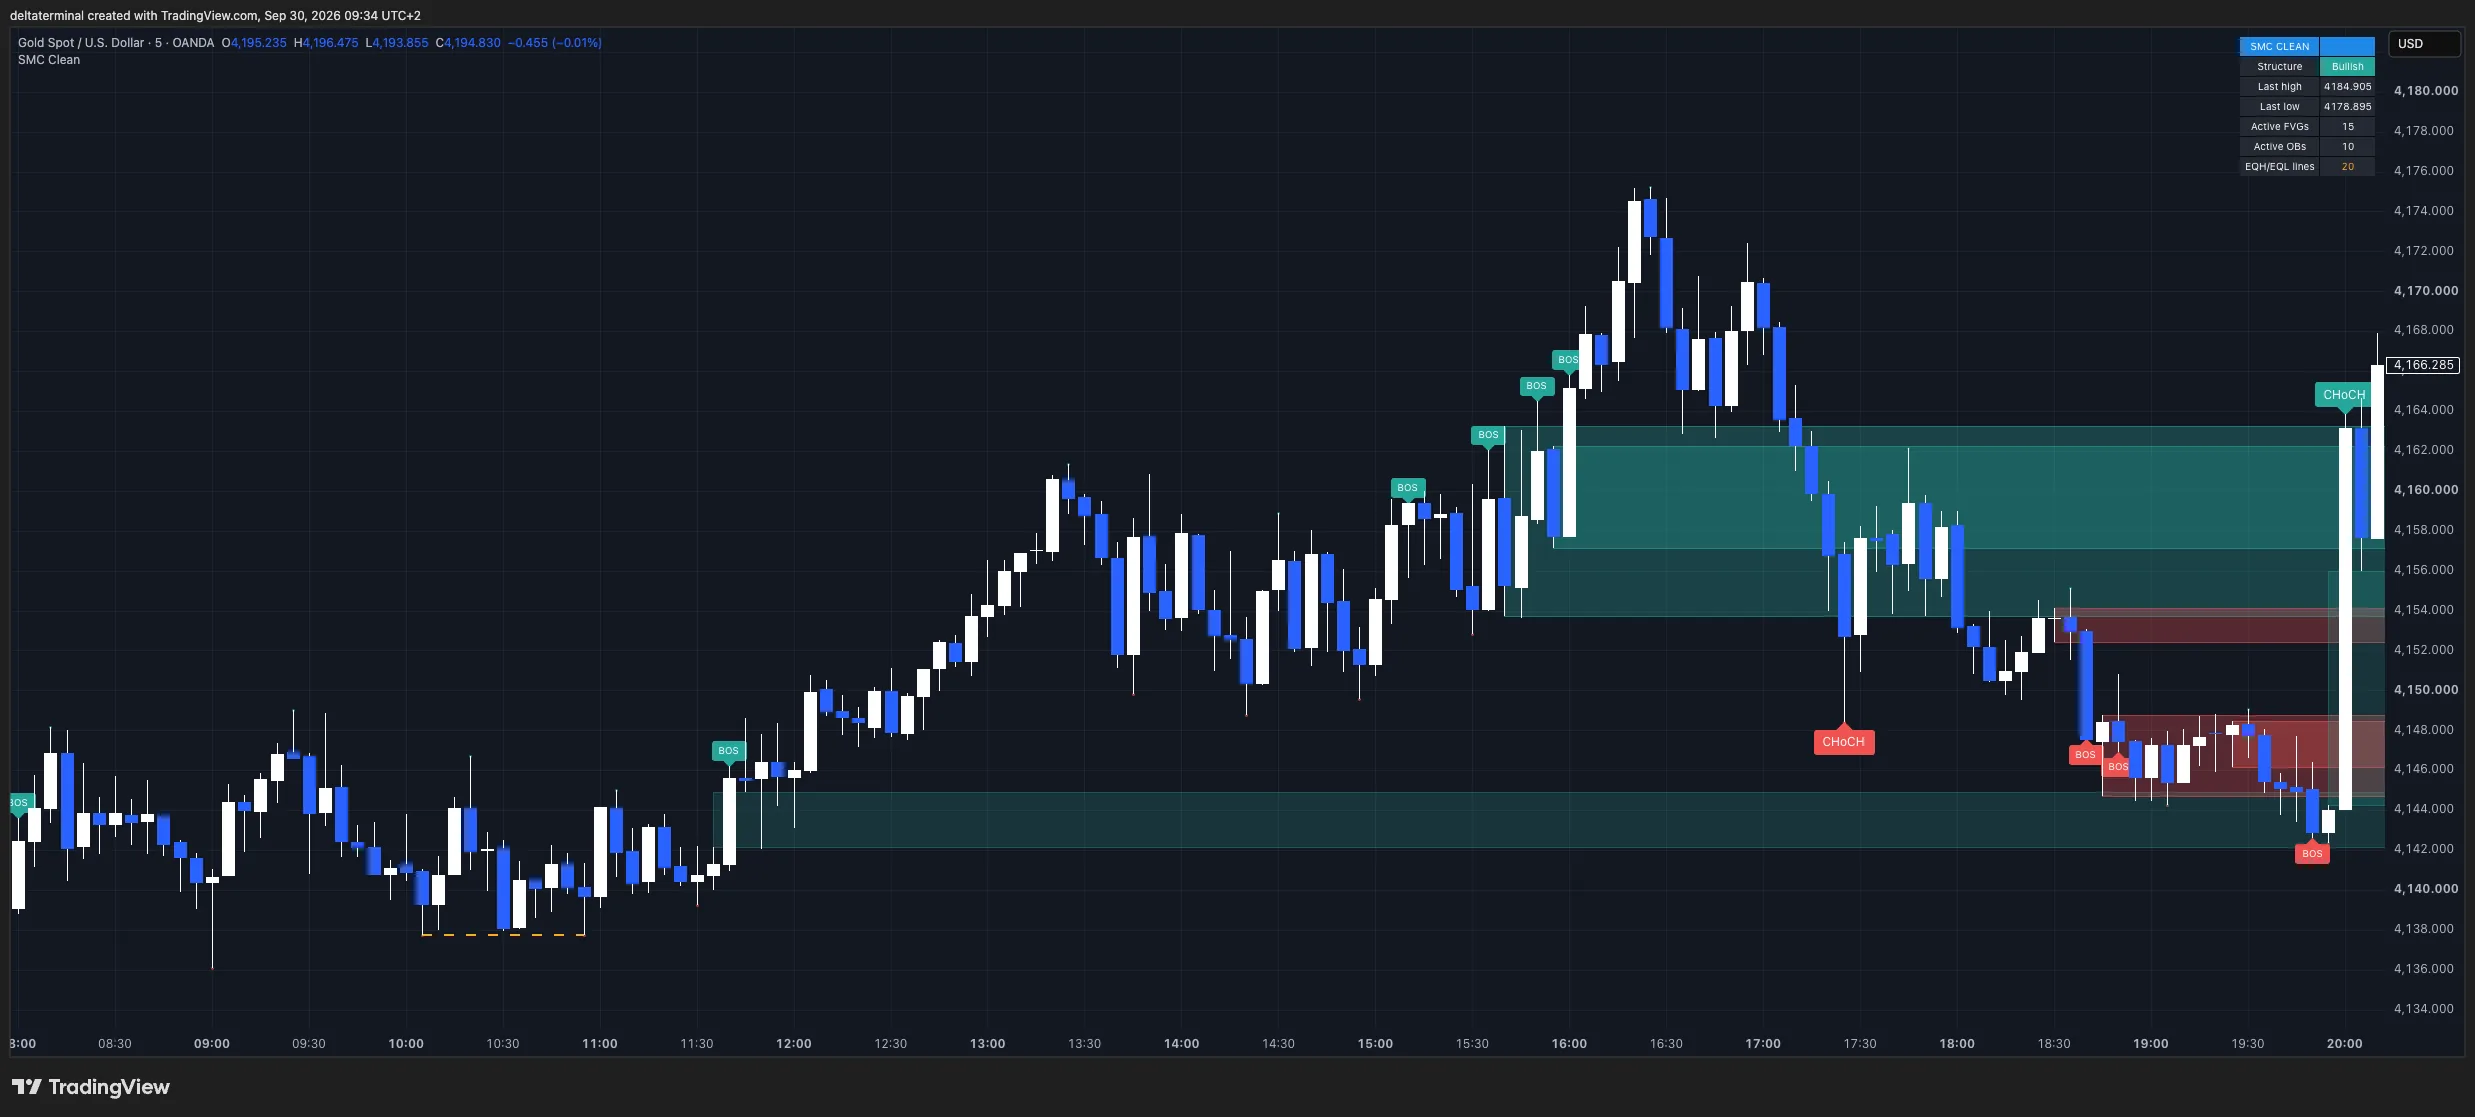
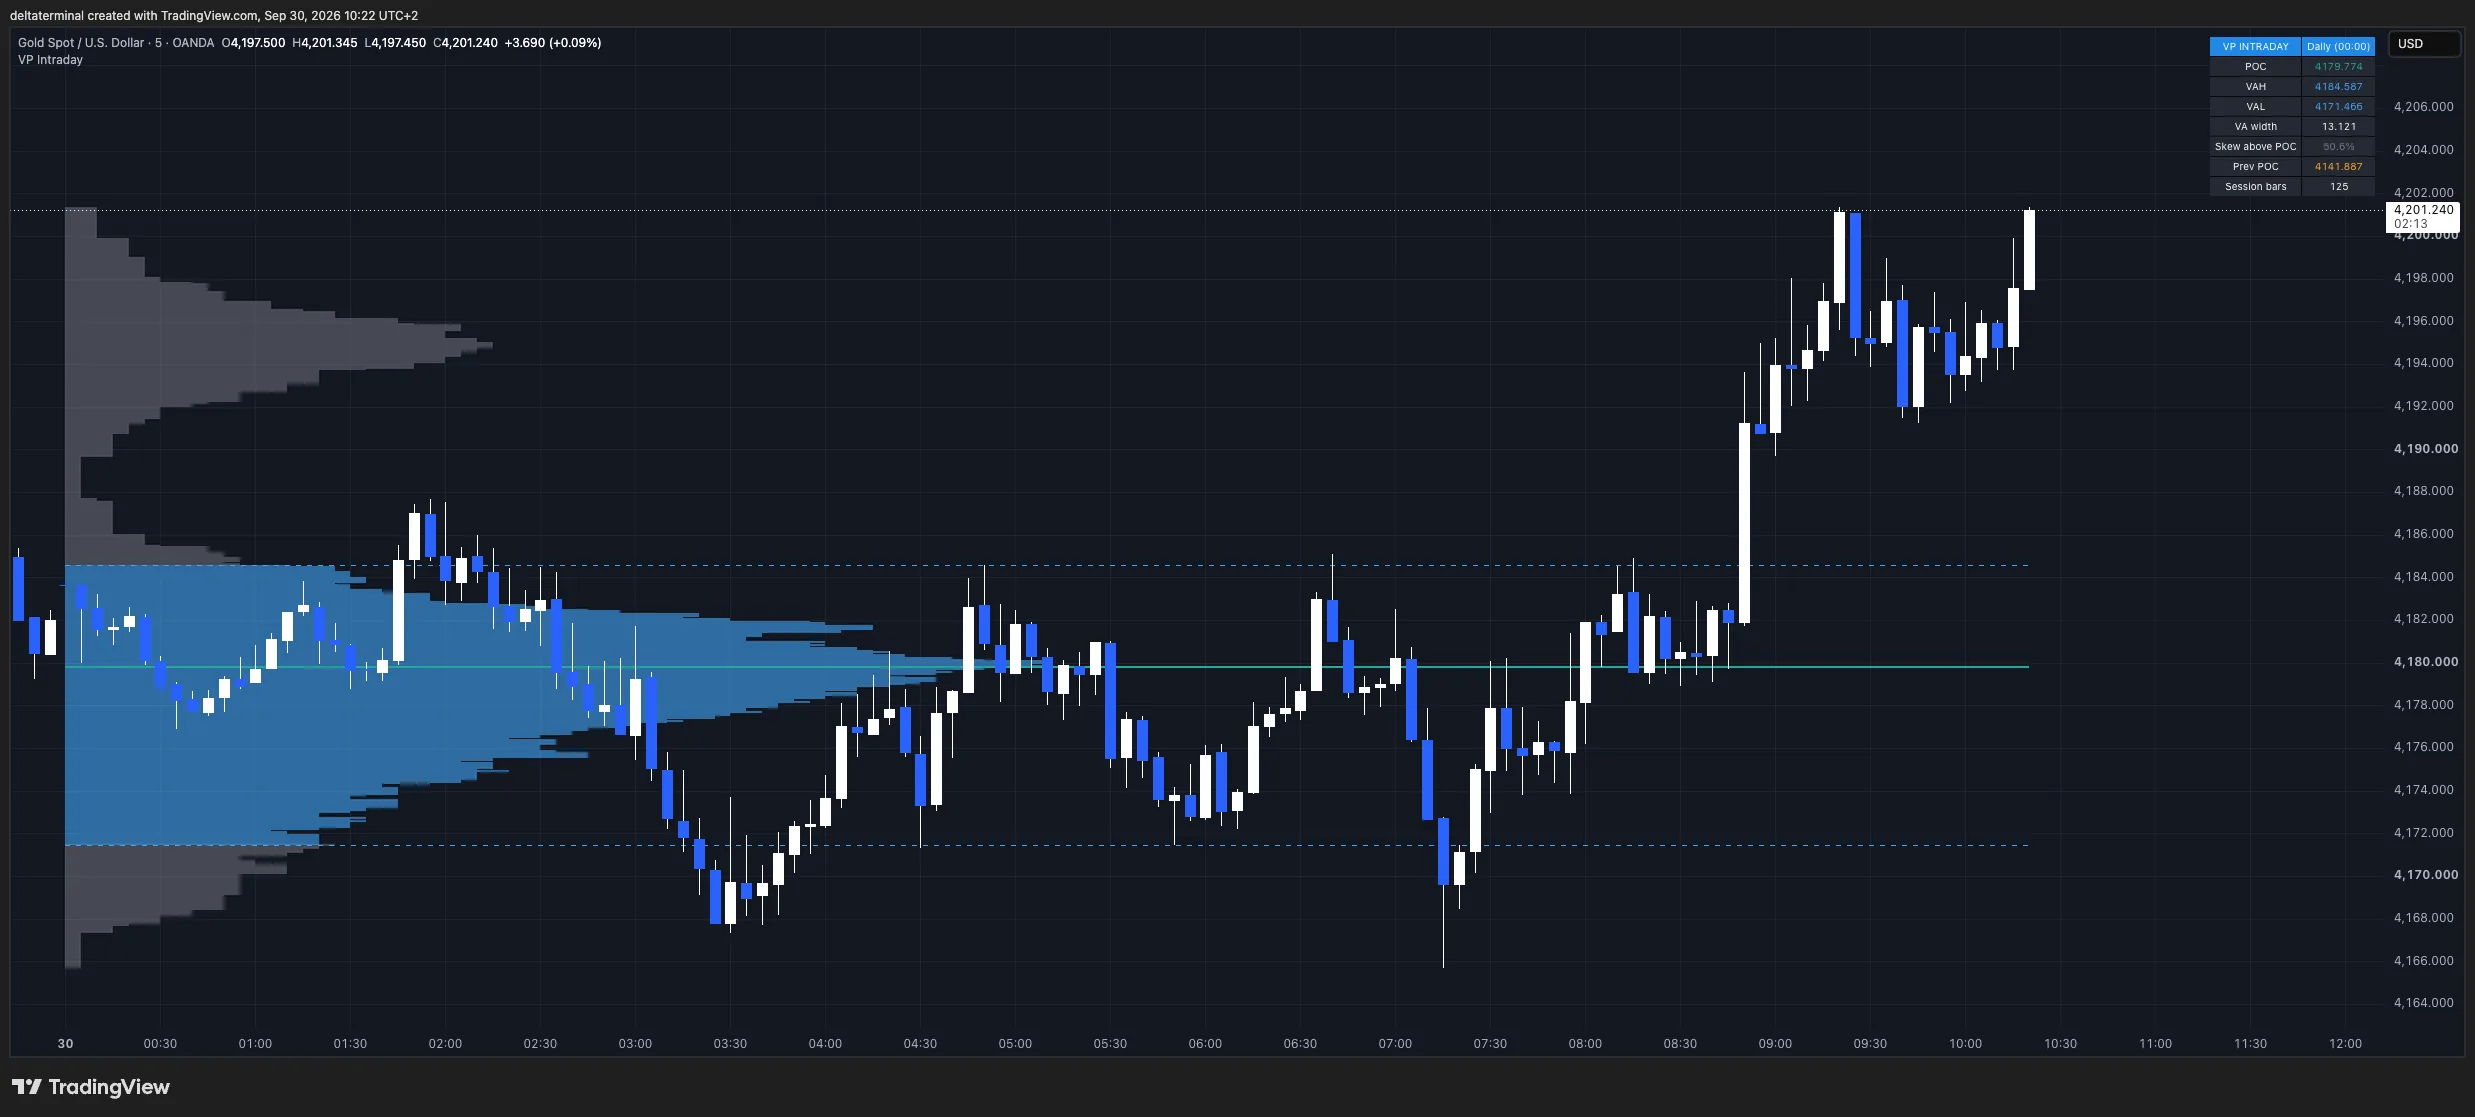
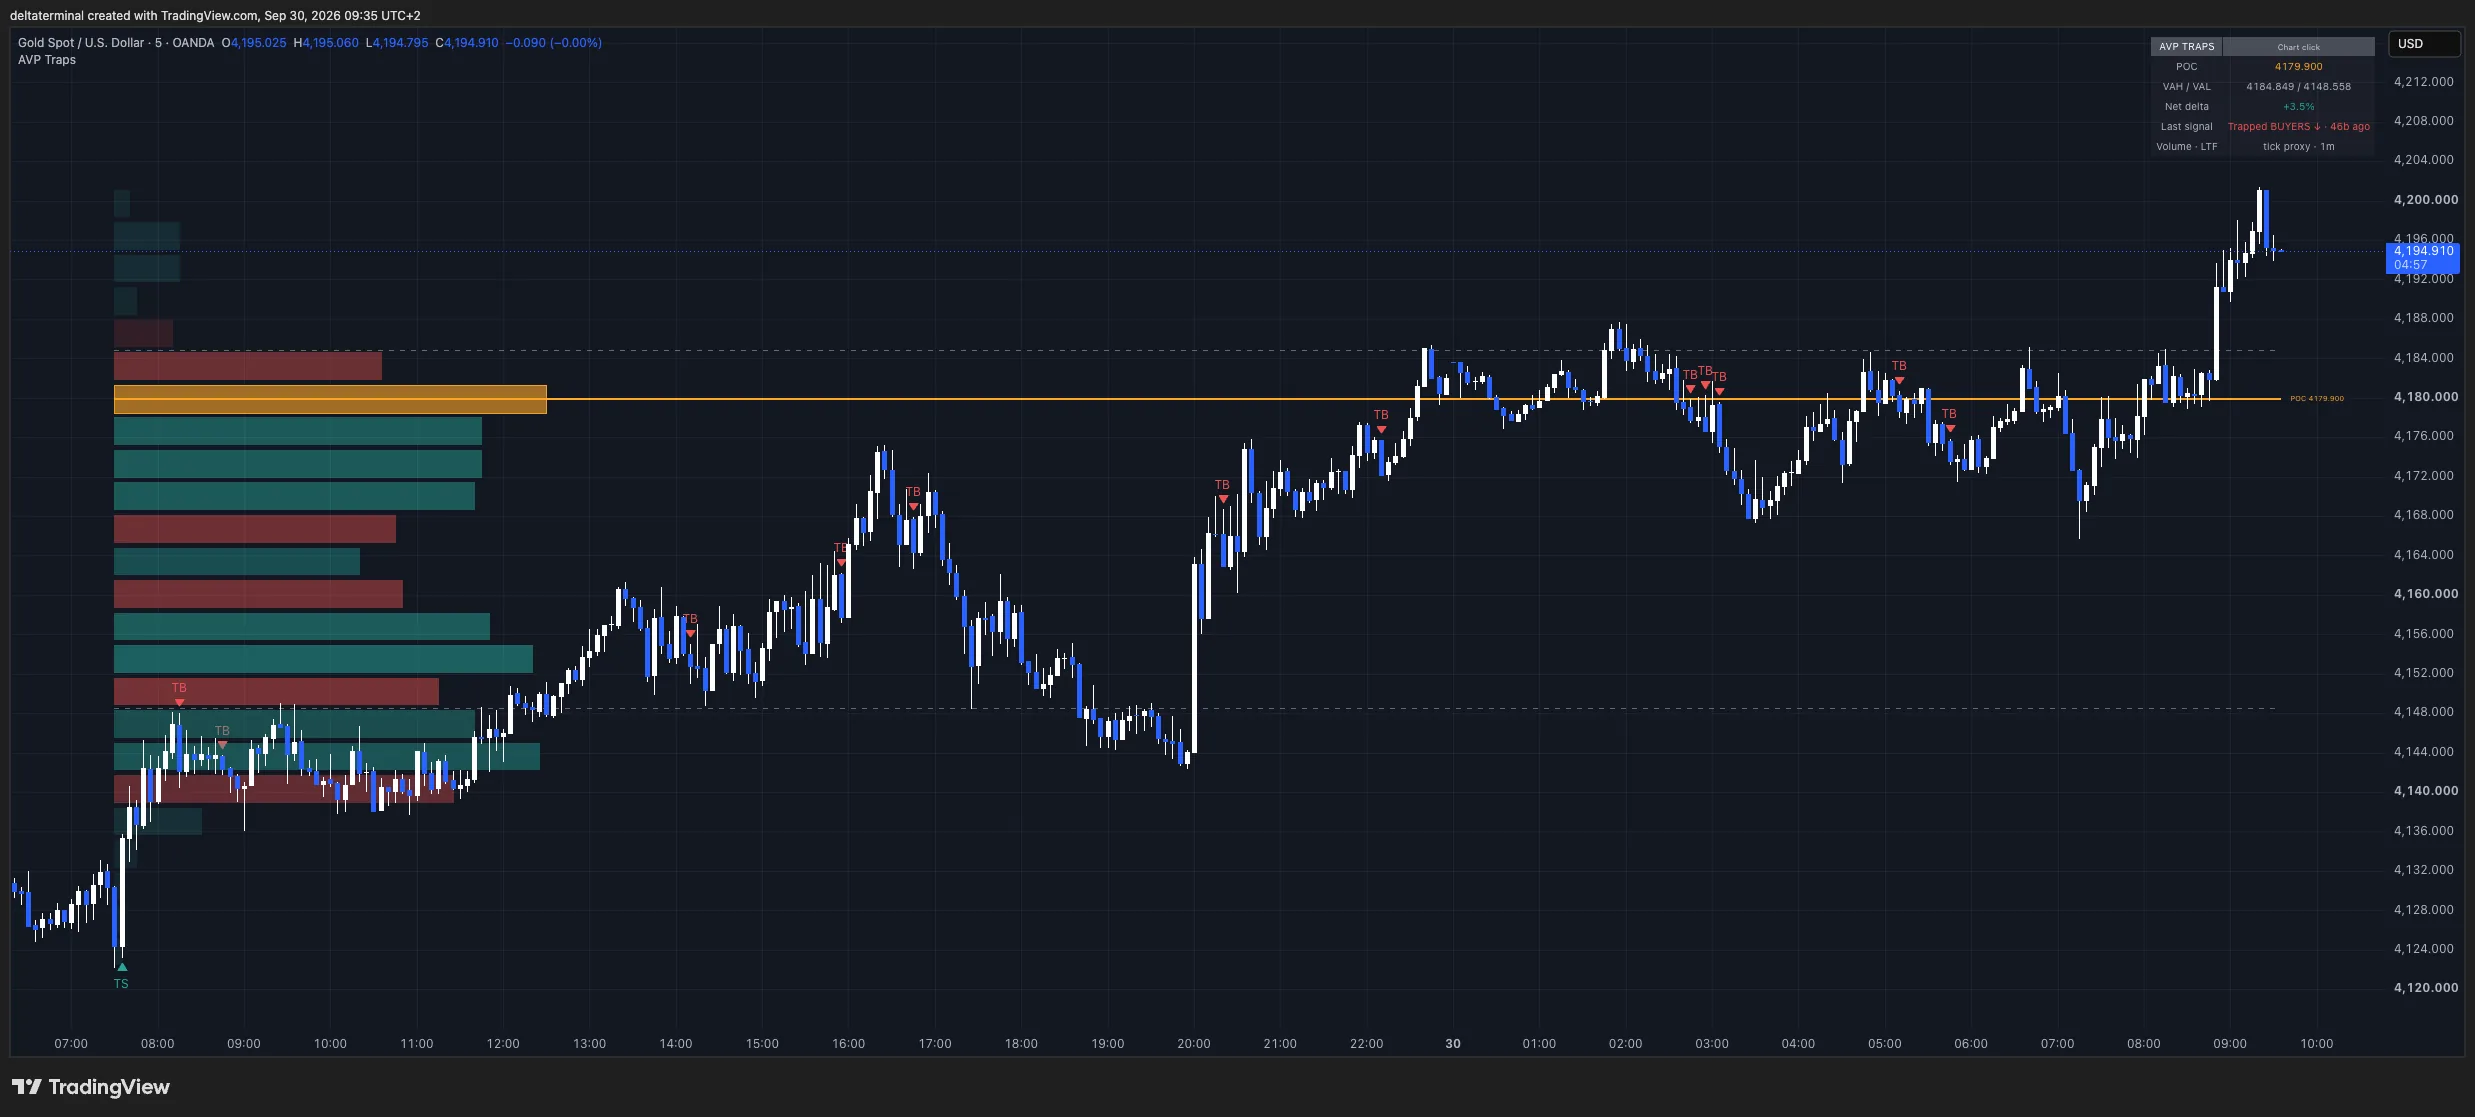
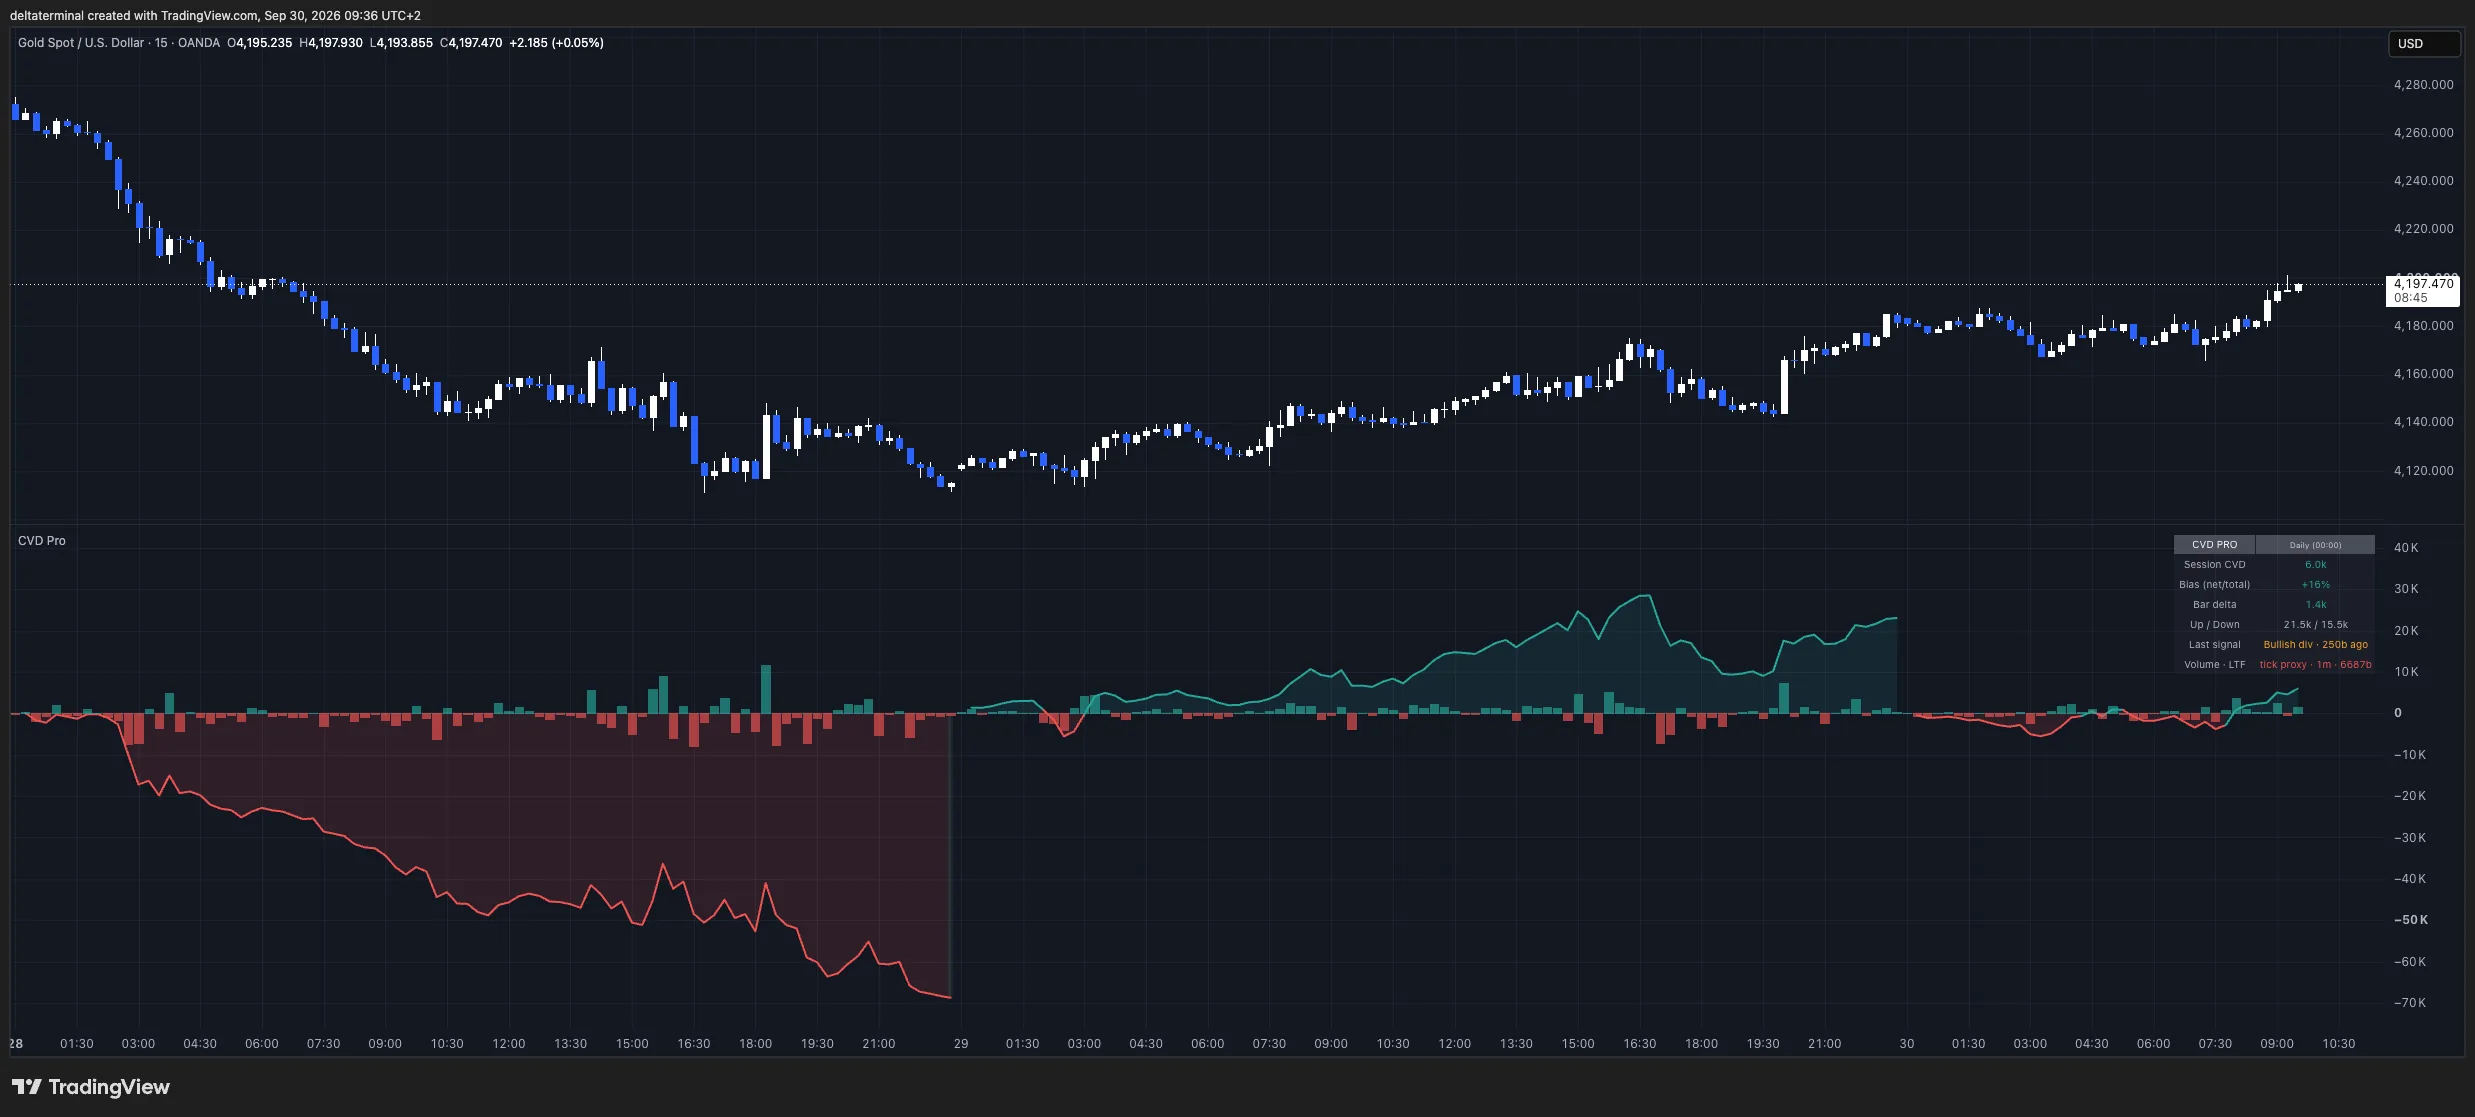
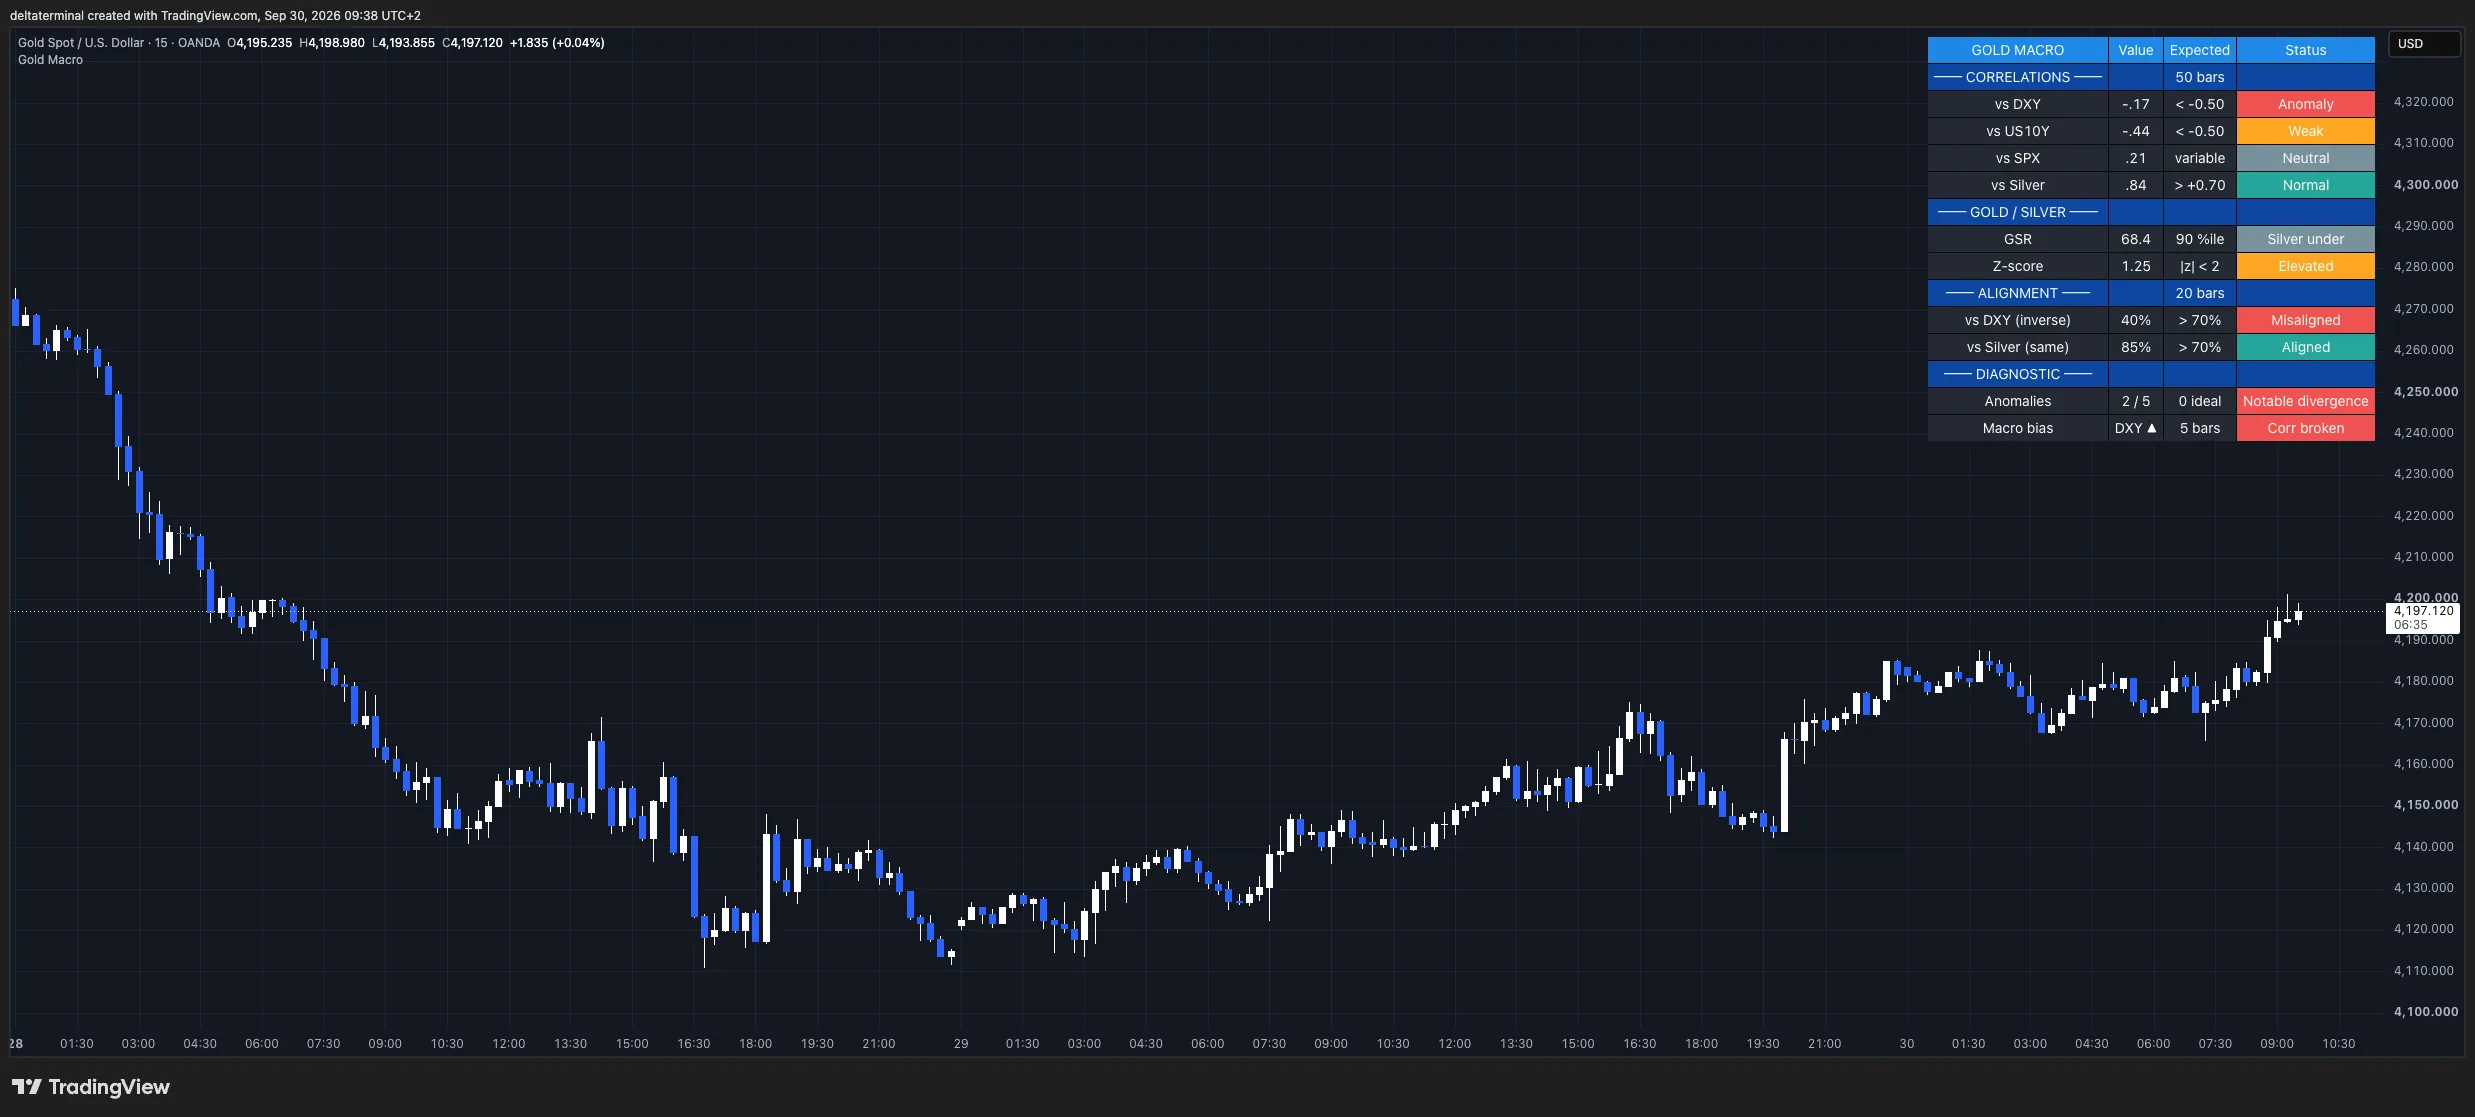
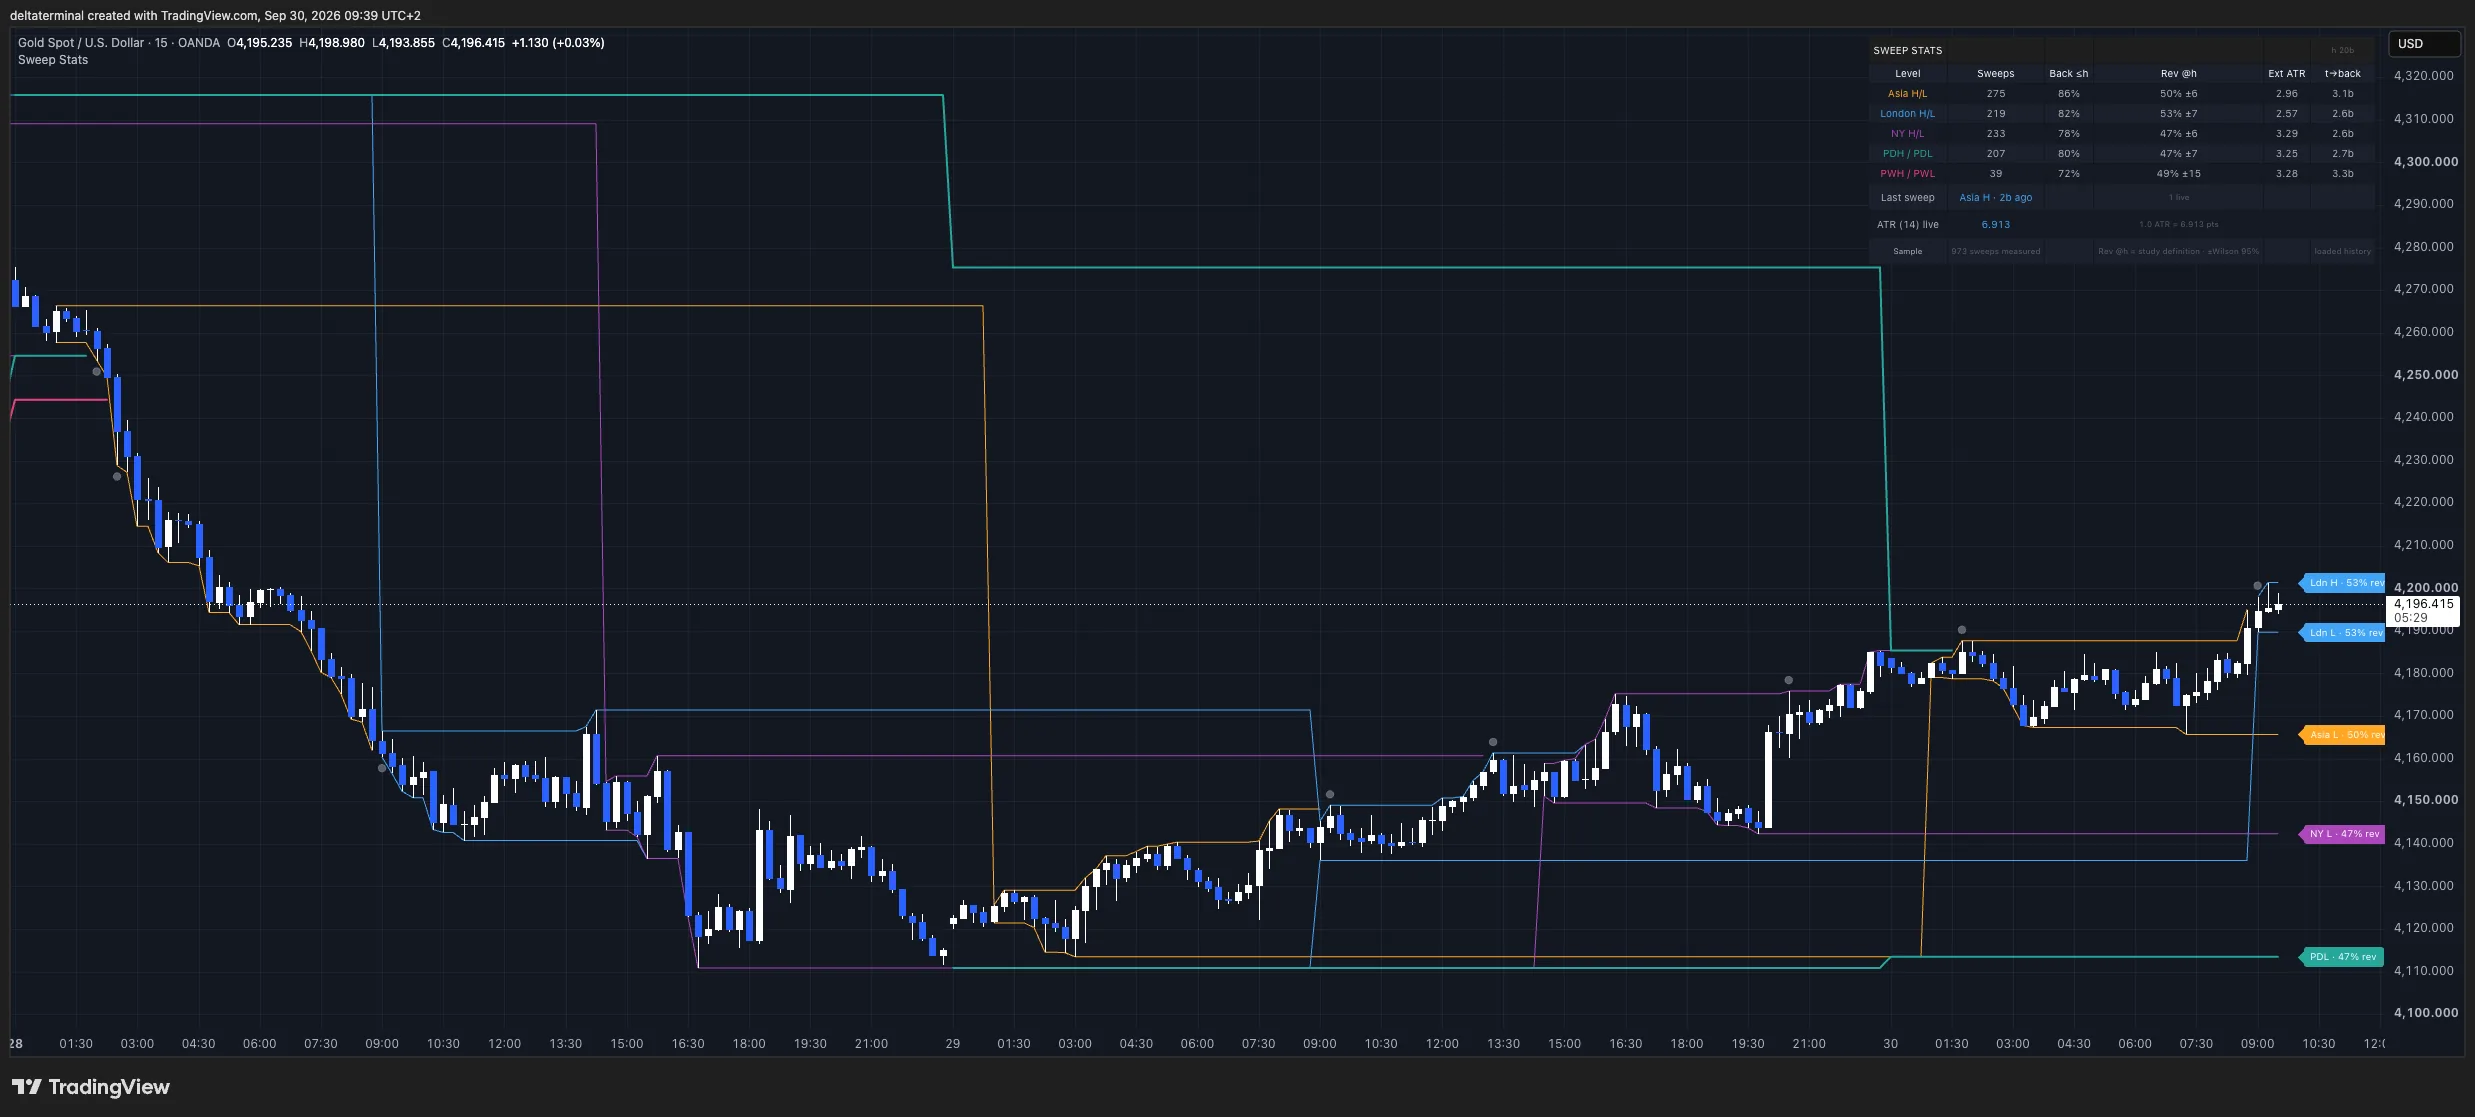
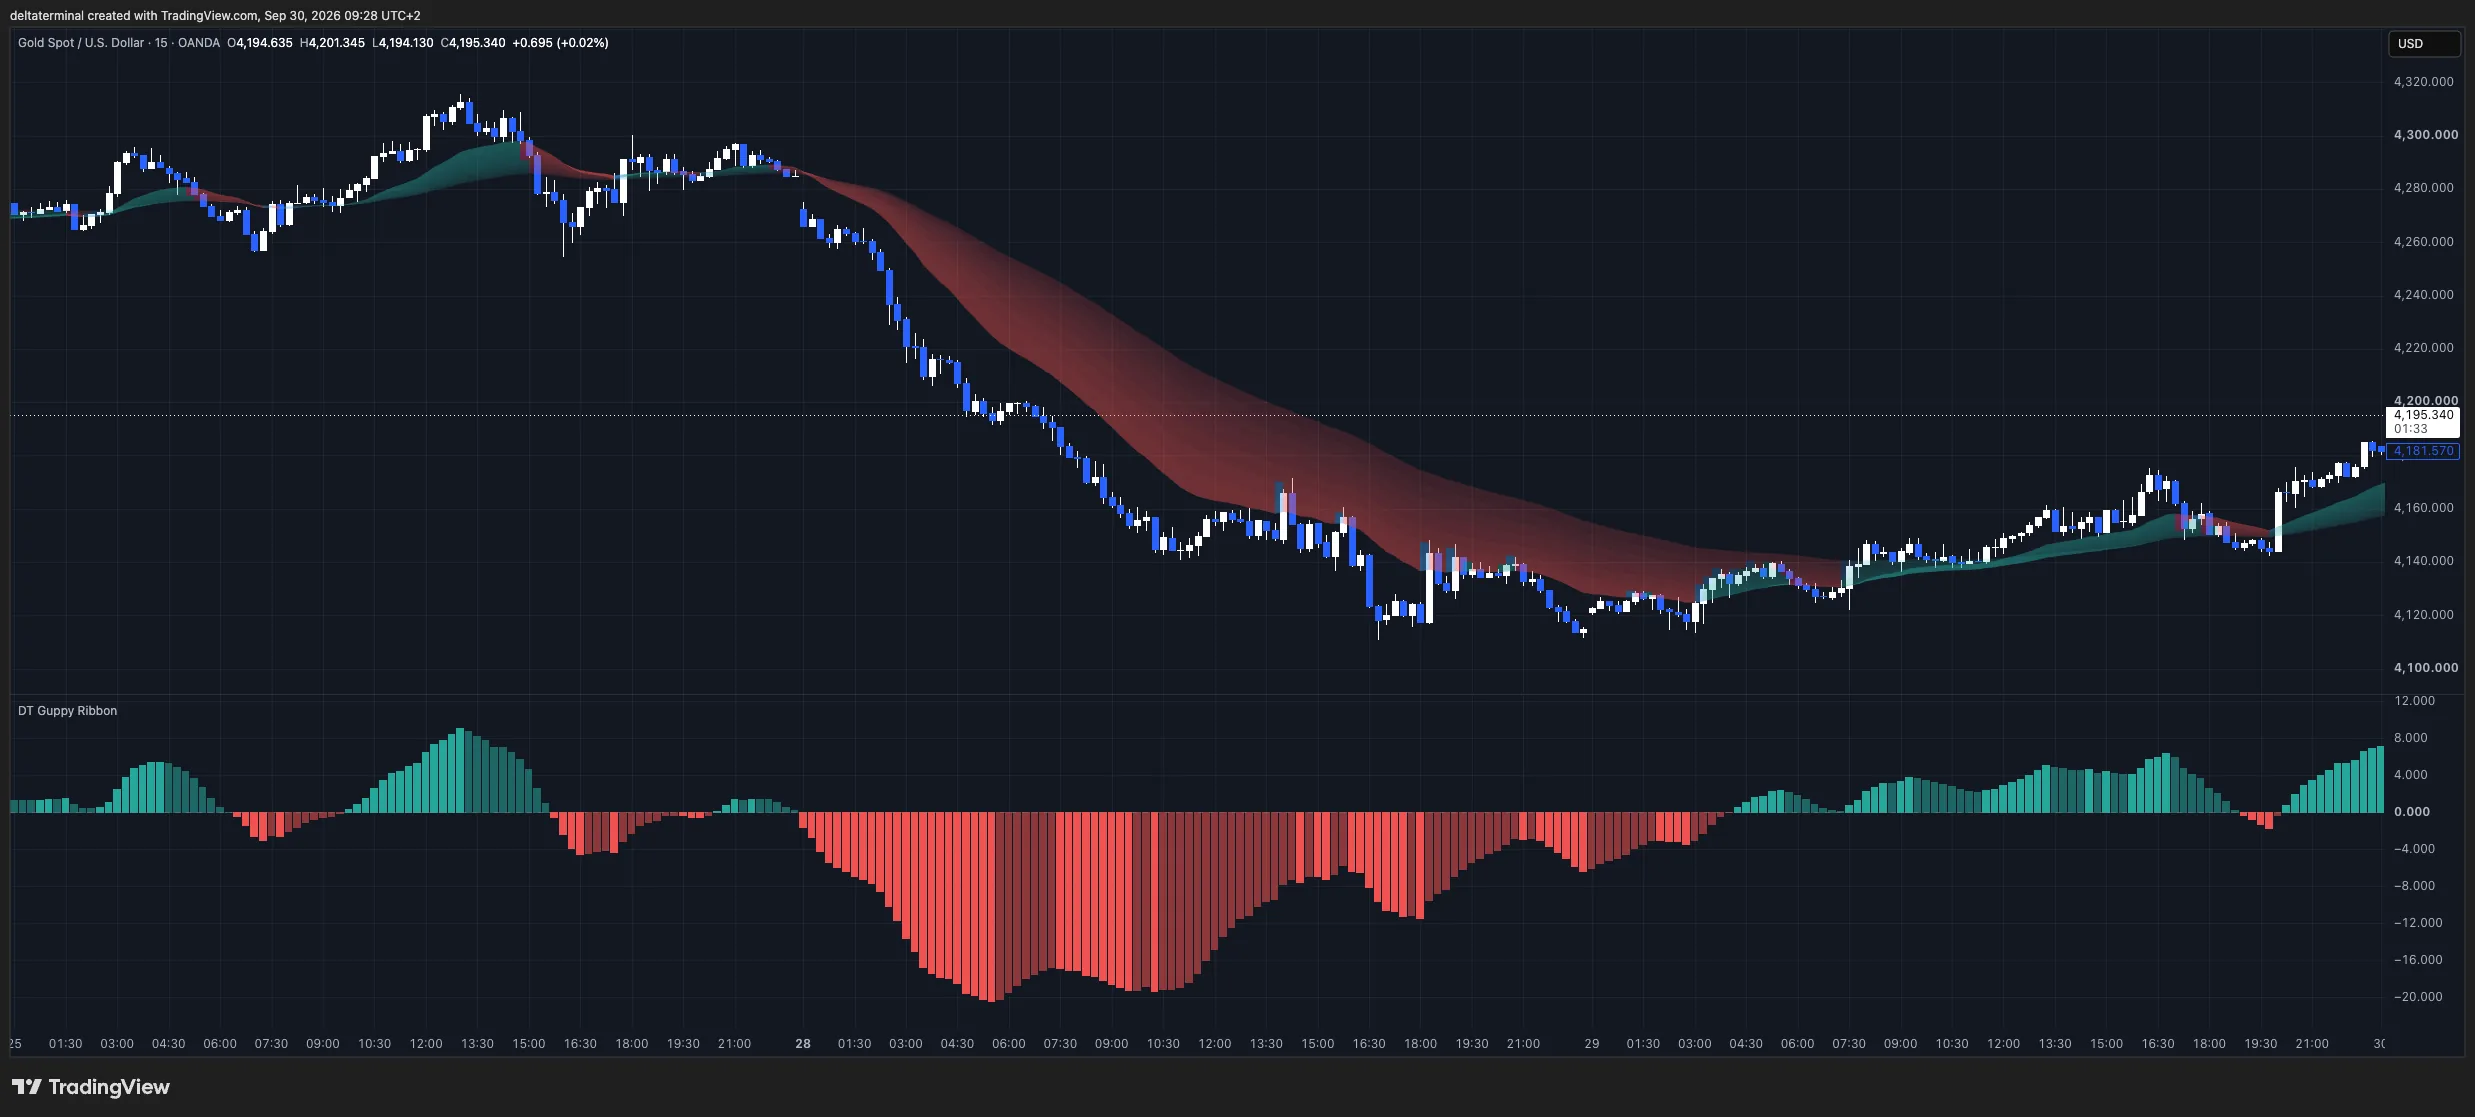
Crops of the same kind of snapshot with the table size set to “large” in the indicator settings — every value you see is computed on the chart, nothing is typed in.
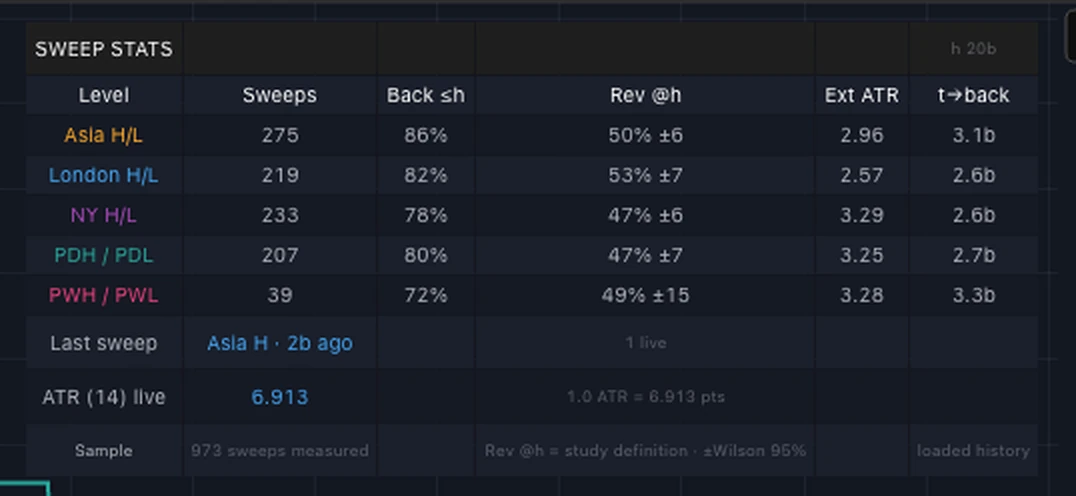
Every statistic our indicators print is measured live on your own loaded history, with the sample size shown — using the same definitions as our studies on 3.5 years of XAU/USD data, published with sample sizes and confidence intervals. Four findings that changed how we trade:
We measured 2,434 liquidity sweeps on XAU/USD over 3.5 years. Baseline end-of-day reversal rate: ~50%. But a few conditional edges are real — full numbers inside.
Read the article →Research · Data25 FOMC days vs 594 control days on XAU/USD: 0.67× morning compression, 4.35× post-announcement expansion, and a whipsaw trough at +30 minutes. The data.
Read the article →Indicator GuidesHow session-anchored VWAP works, why the bands must be volume-weighted, and what 6,945 measured ±2σ touches on Gold say about fading the band — by session and regime.
Read the article →Every line of this suite was written to solve a problem that showed up at the chart every morning. If it's on the chart, it's there because a full-time trader needed it — and because the maths checks out.
Start with the 10-indicator Core Suite, get the complete 18-indicator Pro Suite with monthly research papers, or lock in lifetime access. Yearly plans save 25–28%. Founding members: the first 50 seats of each subscription tier lock $29/mo (Core, code FOUND29) and $39/mo (Pro, code FOUND39) for life.
10 multi-market indicators · or $349/year (save 25%)
All 18 indicators · or $599/year (save 28%)
Pay once. Keep everything forever. 100 seats at $999, then $1,499.
Free tier: one full indicator (SLR Dashboard Lite) + the Foundations ebook, no card required — join free on Whop.
No files to download, no external feed. The indicators are unlocked on your own TradingView account.
Pick a tier (or the free one). Whop handles payment, invoices and cancellation in one click.
Inside your membership, open TradingView — Core indicators (and Pro indicators on Pro/Lifetime), type your exact TradingView username and click Claim Indicators.
On TradingView: Indicators → Invite-only scripts. The scripts appear within minutes. Stuck? Send us your username and we whitelist you by hand.
No. Pivots are confirmed after N bars (that's real pivot detection — anything else is cheating), and all labels and alerts fire on close. The confirmation delay is explicit in the documentation, not hidden in the code.
Every indicator is tested on XAU/USD, ES, NQ, DAX, BTC and EUR/USD. The Core Suite is fully multi-market; the Pro tools (Gold Macro, COT, GVZ) are calibrated for Gold — that's why they're the Pro tier.
No, and on purpose. Every indicator runs 100% on TradingView's native data — nothing to install, no feed to depend on, no subscription to a third-party data service. And no buy/sell arrows: these are context and statistics tools. The few data nuances that exist (tick volume on spot Gold, COT's 3-day lag) are printed on the chart, not hidden.
Designed for M5 through H1 intraday trading. The adaptive filters (Kalman, VWAP bands) also work cleanly on higher timeframes for swing setups.
No — the free TradingView plan works. A paid plan is only useful if you want to run many indicators simultaneously on one chart.
Inside your Whop membership, open the TradingView — Core indicators app (plus TradingView — Pro indicators on Pro and Lifetime), type your exact TradingView username and click Claim Indicators. Within a few minutes the scripts appear on TradingView under Indicators → Invite-only scripts. If anything misbehaves, send us your exact TradingView username — we whitelist manually within 24 hours, usually much faster.
Yes. Monthly and yearly plans cancel in one click inside Whop. Your access continues until the end of the paid period.
30-day full refund, no questions asked. Email support@deltaterminal.io and you get your money back — usually within 48 hours.
There are only 100 seats at $999. After that, Lifetime is $1,499 — or the tier closes.
Better: a free tier. Join free on Whop and you get one full indicator (SLR Dashboard Lite) whitelisted on your TradingView account plus our Foundations ebook — no card, no countdown. And the paid tiers carry a 30-day refund, which is functionally a trial with zero risk.
No. Absolutely not. These are analytical software tools. No indicator in this suite — or any suite, anywhere — is infallible. None claim to predict the future. You, and only you, are responsible for every trading decision you make. Past performance does not guarantee future results. Trading involves substantial risk of loss, including loss of all capital invested.
Eighteen indicators. One coherent toolkit. Developed with a full-time Gold day trader, audited to zero warnings, verifiable on your own chart — and refundable for 30 days.